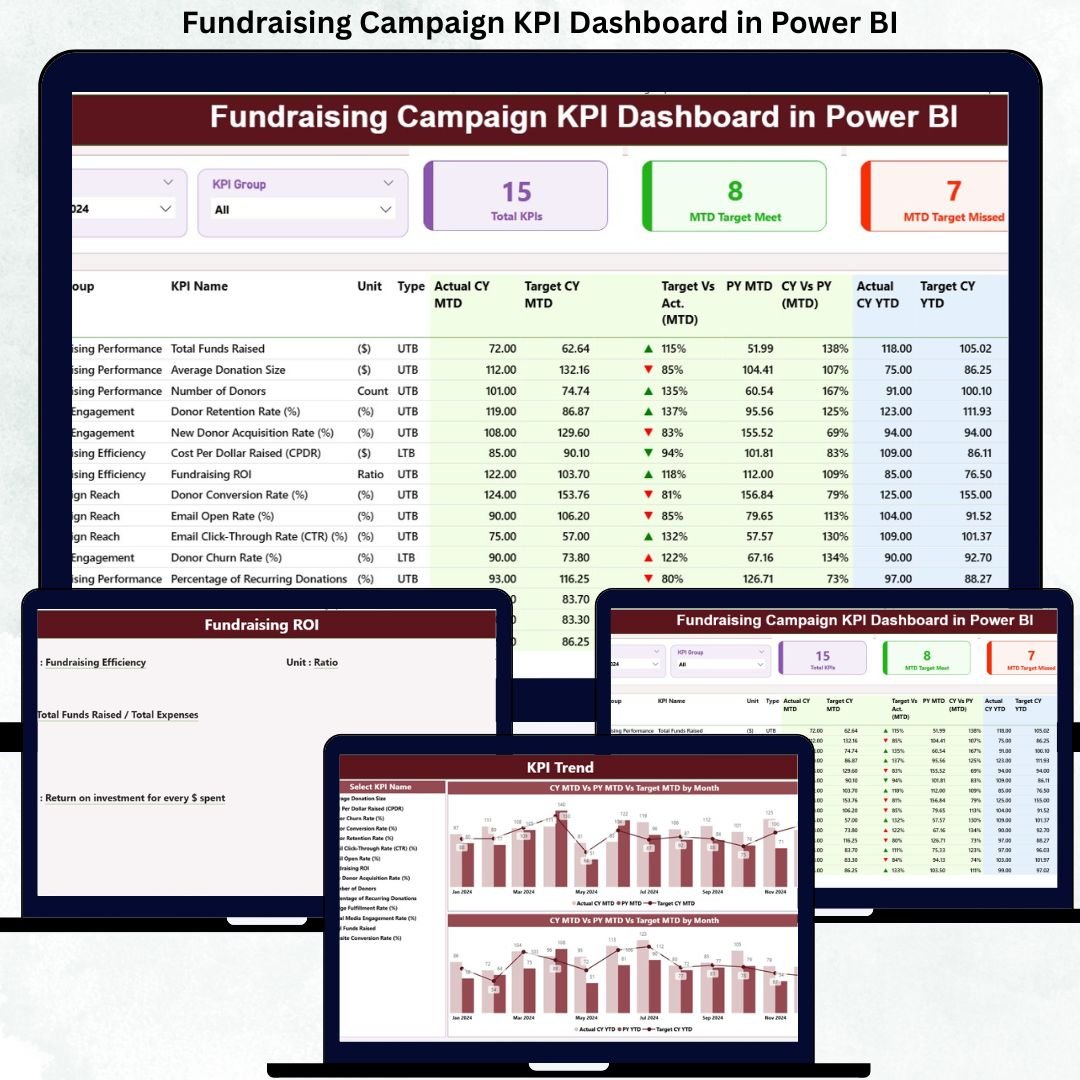
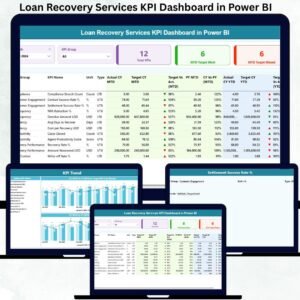
Fundraising campaigns succeed when teams track the right numbers at the right time. However, many organizations still rely on scattered Excel files, delayed reports, and unclear performance indicators. Because of this, leaders react late instead of acting proactively. The Fundraising Campaign KPI Dashboard in Power BI solves this challenge by converting raw fundraising data into clear, real-time, and actionable insights.
This ready-to-use Power BI dashboard gives fundraising managers, nonprofit leaders, and campaign teams complete visibility into Month-to-Date (MTD) and Year-to-Date (YTD) performance. It tracks targets, actual results, previous year comparisons, and trends—all in one structured dashboard. With Excel as the data source and Power BI as the visualization layer, this solution stays flexible, scalable, and easy to maintain.
🚀 Key Features of the Fundraising Campaign KPI Dashboard in Power BI
This dashboard is designed to simplify fundraising performance reviews and improve decision-making speed.
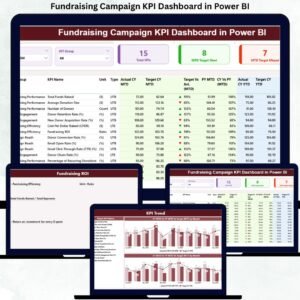
📊 Summary Page – Complete Fundraising Performance Snapshot
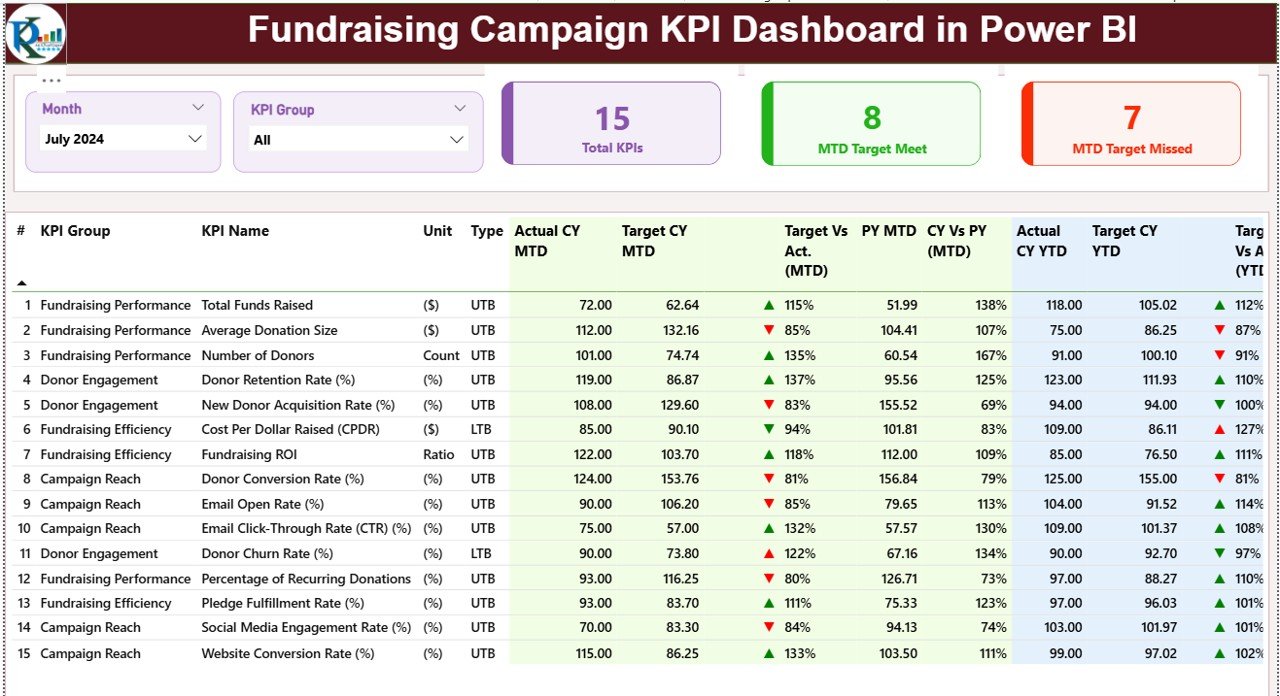
The Summary Page is the main control panel of the dashboard. It instantly shows campaign health and KPI performance.
Key elements include:
-
🎛 Month Slicer – Filter performance by reporting month
-
🎯 KPI Group Slicer – Focus on specific KPI categories
-
🧮 Three KPI Cards
-
Total KPIs Count
-
MTD Target Met Count
-
MTD Target Missed Count
-
Below the cards, a detailed KPI table displays:
-
KPI Number, Group, Name, Unit, and Type (LTB/UTB)
-
MTD Metrics – Actual, Target, Status Icon, Target vs Actual, PY comparison
-
YTD Metrics – Actual, Target, Status Icon, Target vs Actual, PY comparison
This structure helps teams instantly identify which KPIs are performing well and which require immediate attention.
📈 What’s Inside the Fundraising Campaign KPI Dashboard in Power BI
The dashboard includes three structured analytical pages, each serving a specific purpose:
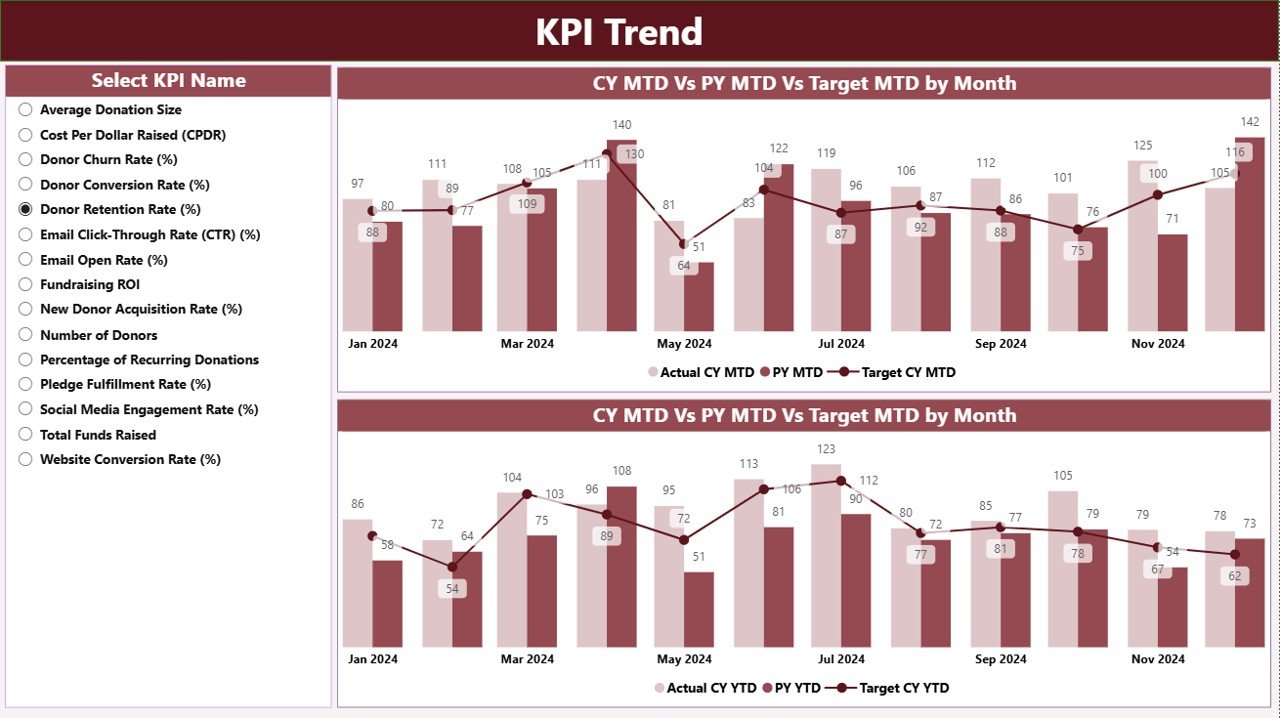
📉 KPI Trend Page – Understand the Story Behind the Numbers
This page focuses on trend analysis instead of static values.
You get:
-
📈 MTD Trend Combo Chart – Current Year, Previous Year, and Target
-
📊 YTD Trend Combo Chart – Cumulative performance over time
-
🎛 KPI Name Slicer – Select any KPI to view its trend instantly
These visuals help teams spot growth patterns, seasonal effects, and early warning signs before targets are missed.
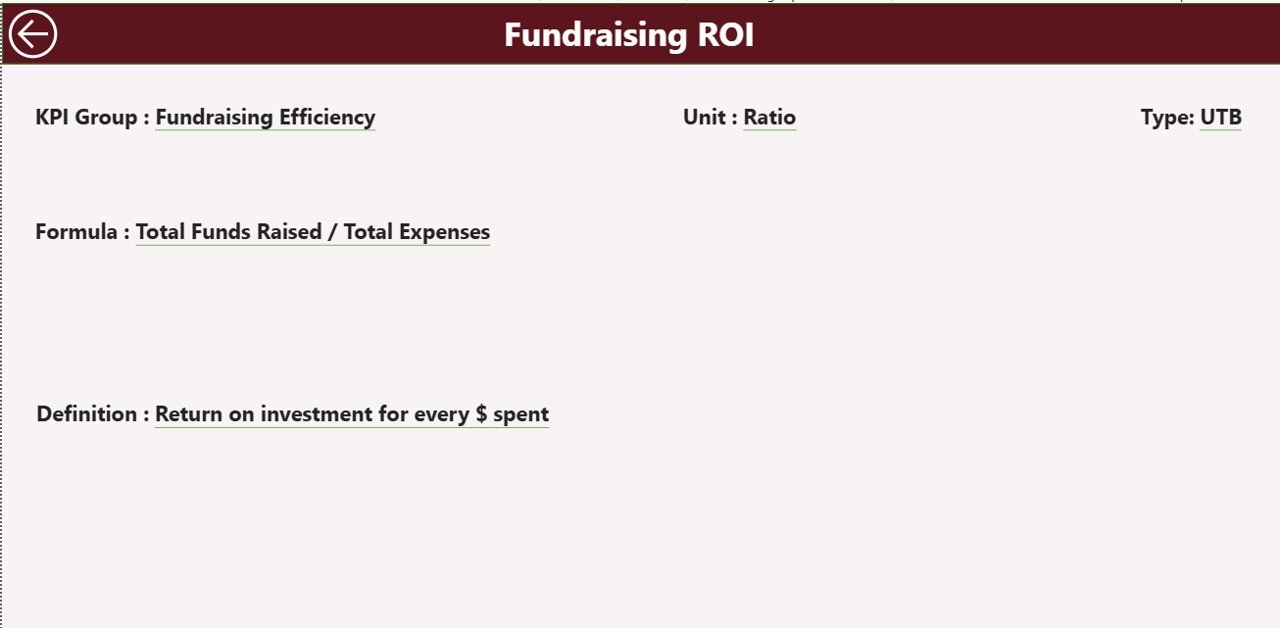
📘 KPI Definition Page – Clear Understanding of Every KPI
This hidden drill-through page ensures transparency and consistency.
It shows:
-
KPI Formula
-
KPI Definition
-
Unit of Measurement
-
KPI Type (LTB or UTB)
A Back Button allows users to return to the Summary Page easily. This page is extremely useful during audits, reviews, and board meetings.
⚙️ How to Use the Fundraising Campaign KPI Dashboard
Using this dashboard is simple and efficient:
1️⃣ Update actual values in the Input_Actual Excel sheet
2️⃣ Update targets in the Input_Target Excel sheet
3️⃣ Maintain KPI logic in the KPI Definition sheet
4️⃣ Refresh the Power BI file
5️⃣ Use slicers to analyze MTD & YTD performance
6️⃣ Review trends and take corrective actions
No complex coding. No advanced Power BI skills required.
👥 Who Can Benefit from This Fundraising Dashboard?
This dashboard is ideal for:
-
🎗 Nonprofit Organizations
-
💝 Charity Foundations
-
📊 Fundraising Managers
-
📣 Campaign Coordinators
-
🧾 Finance & Strategy Teams
-
🧑💼 Board Members & Leadership Teams
Any organization running fundraising campaigns will benefit from this structured KPI reporting system.
### Click here to read the Detailed blog post
Visit our YouTube channel to learn step-by-step video tutorials
👉 Youtube.com/@PKAnExcelExpert


Reviews
There are no reviews yet.