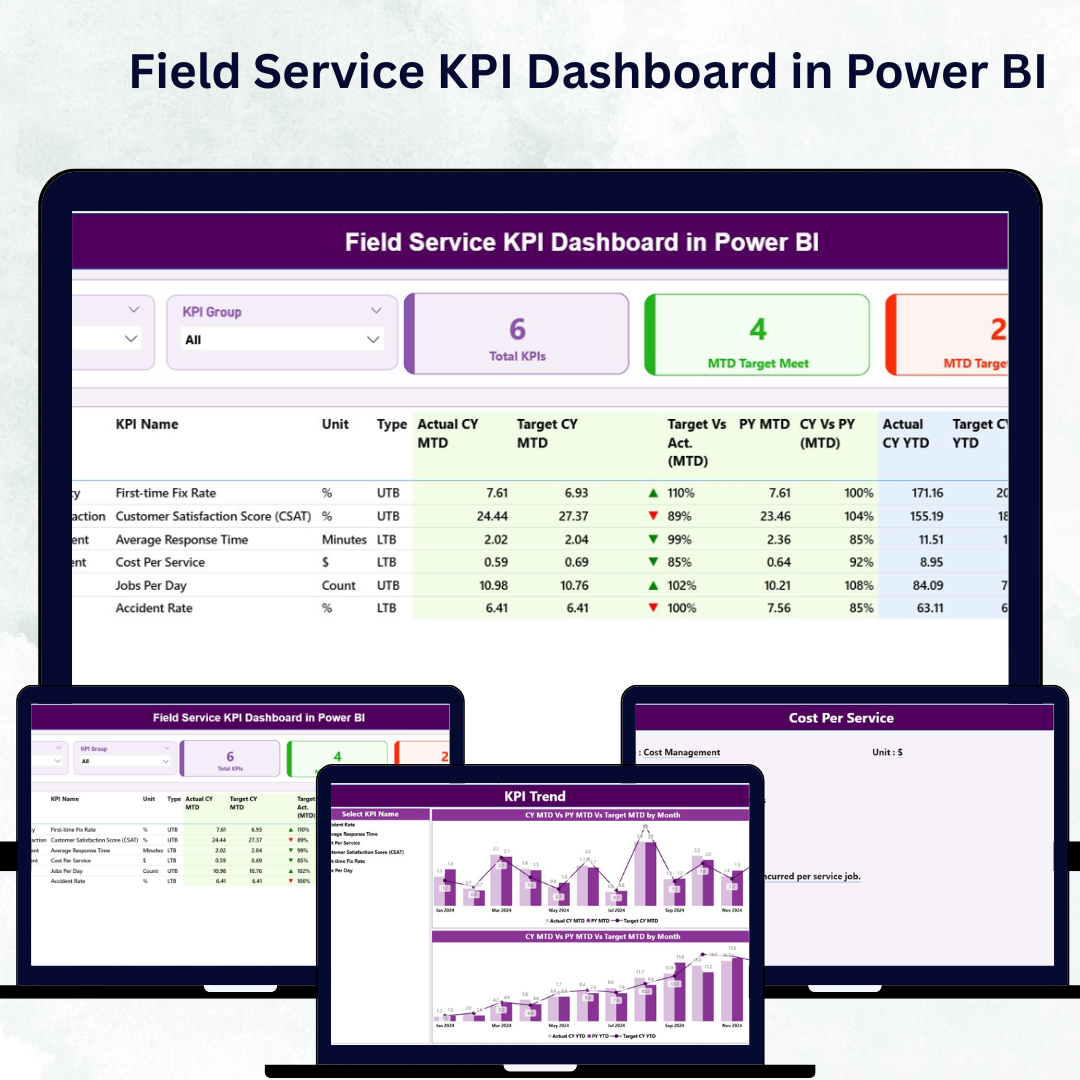
In the world of field operations, speed, accuracy, and customer satisfaction define success. But without the right visibility, managing technicians, tracking performance, and analyzing service results can quickly turn chaotic. That’s where the Field Service KPI Dashboard in Power BI becomes a game-changer.
This ready-to-use interactive dashboard empowers organizations to monitor KPIs, track team productivity, and measure customer satisfaction in real time. Built using Excel as a data source and Power BI’s dynamic visuals, it turns complex service data into actionable insights — allowing managers to identify bottlenecks, evaluate performance, and make smarter, data-driven decisions.
Whether you manage maintenance teams, repair services, or installation technicians, this Power BI dashboard helps you deliver operational excellence with transparency, speed, and control.
🚀 Key Features of Field Service KPI Dashboard in Power BI
✅ 📊 Three Analytical Pages – Includes Summary, KPI Trend, and KPI Definition pages for comprehensive analysis.
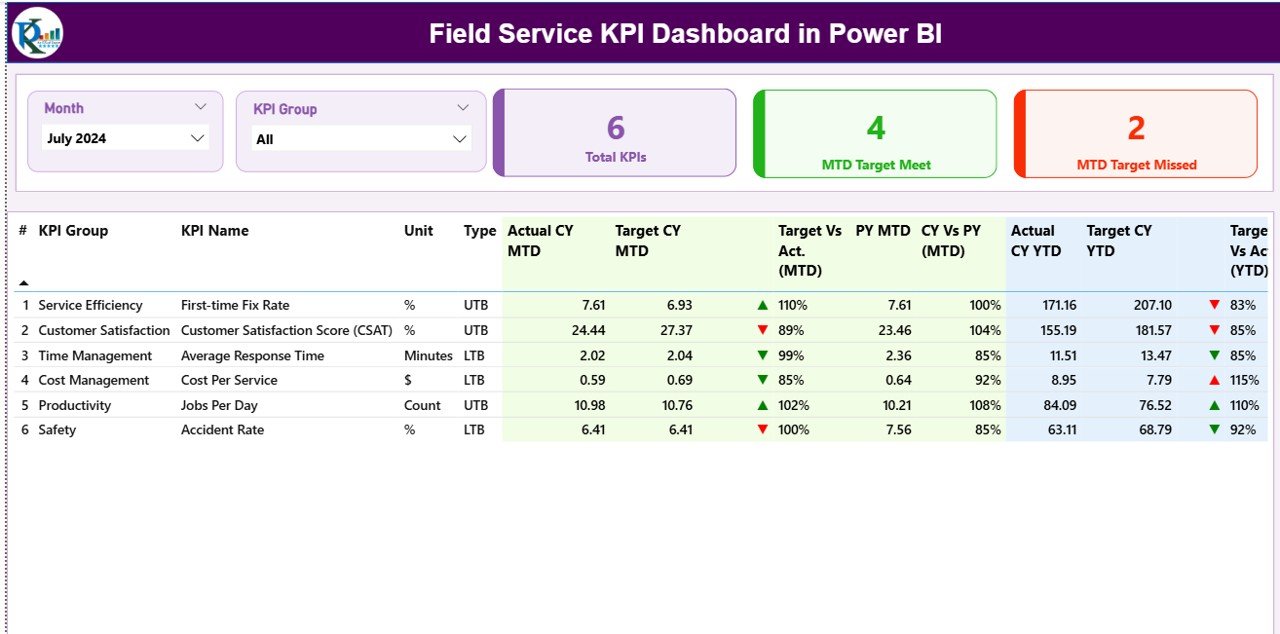
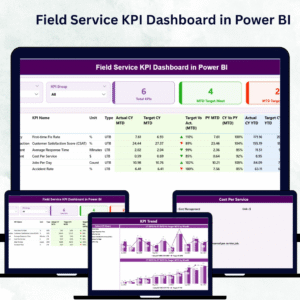
✅ 🎯 Performance Tracking – Instantly view Total KPIs, MTD Target Met, and MTD Target Missed using visually appealing cards.
✅ 📈 KPI Summary Table – Detailed breakdown with KPI Number, Name, Type (LTB/UTB), Actual, Target, Variance %, and YoY comparisons.
✅ 🧩 Real-Time Comparisons – Track both Month-to-Date (MTD) and Year-to-Date (YTD) results alongside previous year’s data.
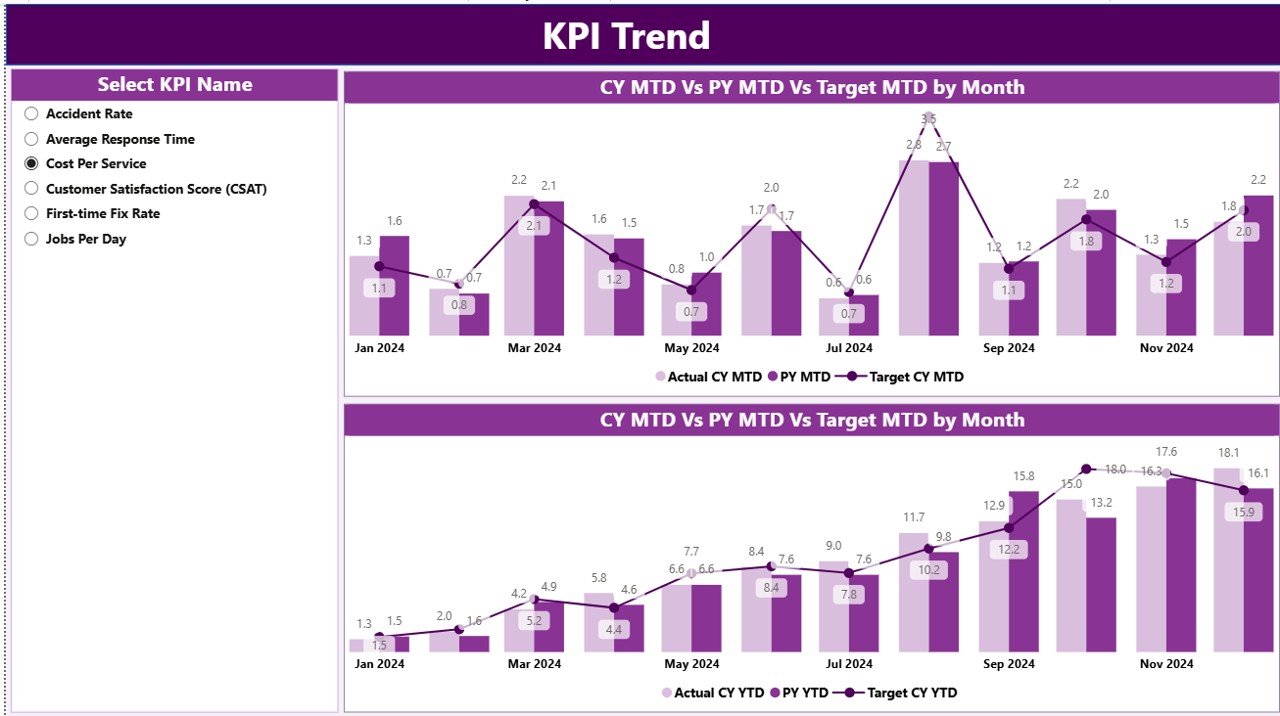
✅ 📊 KPI Trend Page – View MTD & YTD performance trends using dual combo charts to identify seasonal shifts and target gaps.
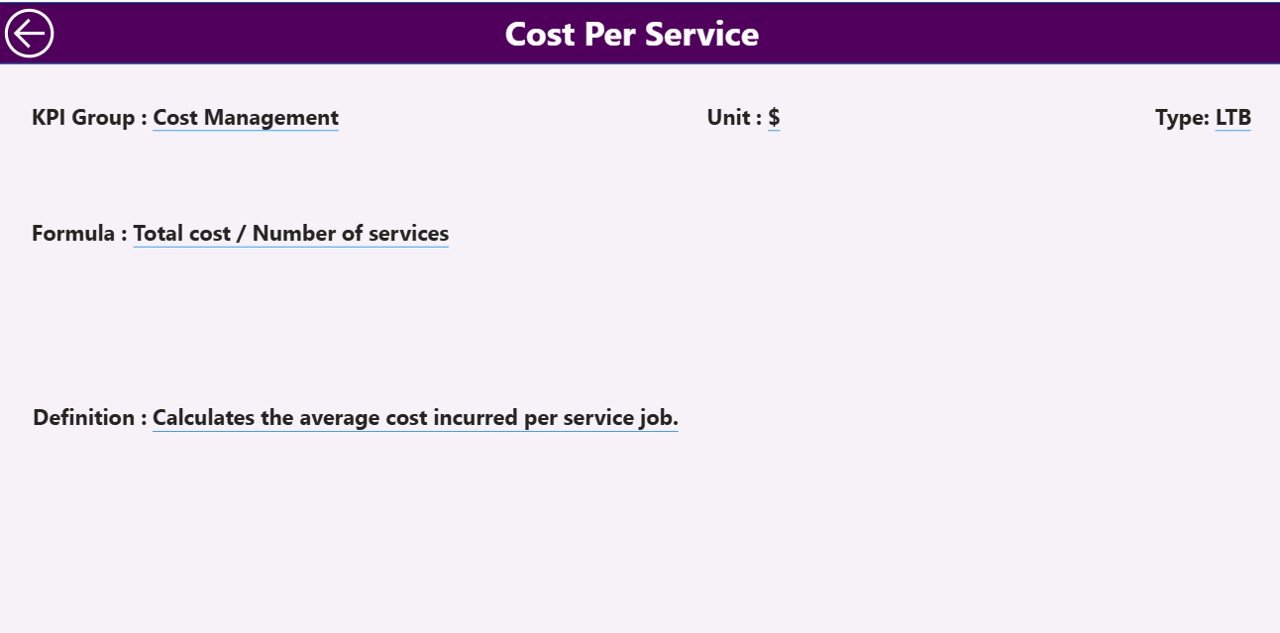
✅ 🔍 KPI Drill-Through Page – Understand each KPI’s definition, formula, unit, and type with a single click.
✅ 🧾 Excel-Powered Data Source – Easy-to-maintain Excel sheets for Actuals, Targets, and KPI Definitions.
✅ 📂 Interactive Slicers – Filter by Month and KPI Group for instant, focused insights.
✅ 📉 Dynamic Indicators – Green ▲ for achieved targets, Red ▼ for missed — instantly showing performance status.
✅ ⚙️ Fully Customizable – Modify KPIs, color themes, or chart types to match your business reporting needs.
💼 What’s Inside the Field Service KPI Dashboard in Power BI
Inside this Power BI file, you’ll find a complete structure designed to simplify field service performance tracking:
📁 Summary Page: The main dashboard view showcasing KPI cards, filters, and a detailed KPI table for MTD & YTD performance.
📁 KPI Trend Page: Visualize historical performance patterns with combo charts comparing Actuals, Targets, and Previous Year.
📁 KPI Definition Page: A hidden drill-through sheet that explains each KPI with formulas, definitions, and type labels (LTB/UTB).
📊 Excel Data Source:
-
Input_Actual: Stores monthly and yearly actuals.
-
Input_Target: Tracks targets for each KPI and month.
-
KPI Definition: Documents KPI names, formulas, and logic.
This structure ensures seamless data integration, automatic refreshes, and crystal-clear analysis.
🧭 How to Use the Field Service KPI Dashboard in Power BI
1️⃣ Prepare Your Data: Update Actual and Target values in Excel.
2️⃣ Load File into Power BI: Connect the Excel data to the Power BI dashboard.
3️⃣ Refresh Data: Click refresh to see the latest results.
4️⃣ Use Slicers: Filter by month or KPI group for custom insights.
5️⃣ Analyze Trends: Review MTD vs YTD graphs for each KPI.
6️⃣ Drill Through: Click any KPI to view its formula and definition.
7️⃣ Share Reports: Publish to Power BI Service for secure team access.
No advanced coding or BI expertise required — simply refresh and review!
👨💼 Who Can Benefit from This Field Service KPI Dashboard
🏗️ Field Operations Managers: Monitor service delivery speed and technician performance.
🧰 Maintenance Teams: Track first-time fix rates and job completion percentages.
💡 Executives & Directors: Get top-level visibility into service quality and operational KPIs.
📋 Data Analysts: Identify performance trends and inefficiencies for optimization.
👷 Technicians: Understand personal targets and team-level progress.
From small service startups to global maintenance teams, this dashboard ensures efficiency, accountability, and measurable success across your field operations.
🔗 Click here to read the Detailed blog post
📺 Visit our YouTube channel to learn step-by-step video tutorials
👉 YouTube.com/@PKAnExcelExpert


Reviews
There are no reviews yet.