

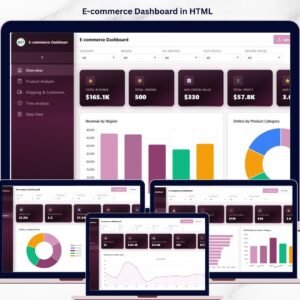
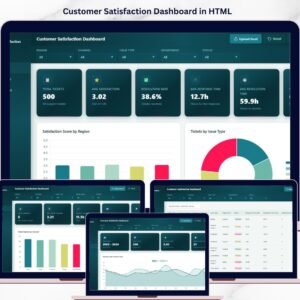
Customer Satisfaction Dashboard in HTML is a professionally designed, interactive, and browser-based analytics template built for customer service managers, quality assurance teams, and business owners who want to monitor satisfaction metrics, track SLA performance, analyze channel effectiveness, and identify service improvement areas from a single centralized interface. If your customer feedback data is buried in spreadsheets or disconnected CRM tools, this dashboard brings everything together into one stunning, filterable, and responsive HTML Dashboard that works instantly in any web browser.Customer Satisfaction Dashboard in HTML
Tracking customer satisfaction is no longer optional — it is the key competitive advantage that separates growing businesses from stagnant ones. This Customer Satisfaction Dashboard in HTML consolidates all your critical CSAT data into one dynamic reporting hub. Simply open the file, explore interactive charts, apply filters by department, channel, region, or time period, and uncover the insights that drive better customer experiences and higher retention rates.
🔑 Key Features of Customer Satisfaction Dashboard in HTML
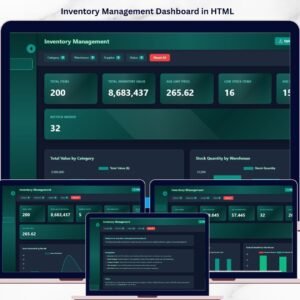
📊 Comprehensive KPI Monitoring — Track essential customer satisfaction metrics including Total Tickets, Average Satisfaction Score, Resolution Rate, Average Response Time, Average Resolution Time, and SLA Breach Rate all from dynamic KPI cards on the overview page.
📈 Interactive Charts and Visualizations — Analyze satisfaction performance through dynamic charts such as Satisfaction Score by Region, Tickets by Issue Type, Tickets by Department, Ticket Status Distribution, and Satisfaction Score by Department with visual clarity and precision.
🎯 Smart Filters and Slicers — Instantly filter your data by department, service channel, region, time period, issue type, and ticket status to drill down into the exact insights you need.
🖥️ Browser-Based — No Software Needed — This dashboard runs entirely inside your web browser. No need to install Excel, Power BI, or any other tool. Just open the HTML file and start analyzing your customer satisfaction data immediately.
🎨 Professional SaaS-Style Design — Enjoy a clean, modern, and premium design that looks like an enterprise-grade analytics dashboard application — not a basic spreadsheet.
🔄 Multi-Tab Navigation — Switch between multiple dashboard pages like Overview, Channel Insights, SLA Performance, Time Analysis, and Data View using smooth tab-based navigation.
📱 Responsive Layout — The dashboard is optimized to work beautifully on desktops, tablets, and mobile devices so you can check your customer satisfaction metrics anywhere.
💾 Data Explorer with Export — Access a detailed data table with search functionality, sortable columns, pagination, and CSV export options for deeper analysis and auditing.
 Customer Satisfaction Dashboard – Overview
📦 What’s Inside the Customer Satisfaction Dashboard in HTML
This dashboard template includes five interactive pages, each designed to give you deep insights into different dimensions of customer satisfaction:
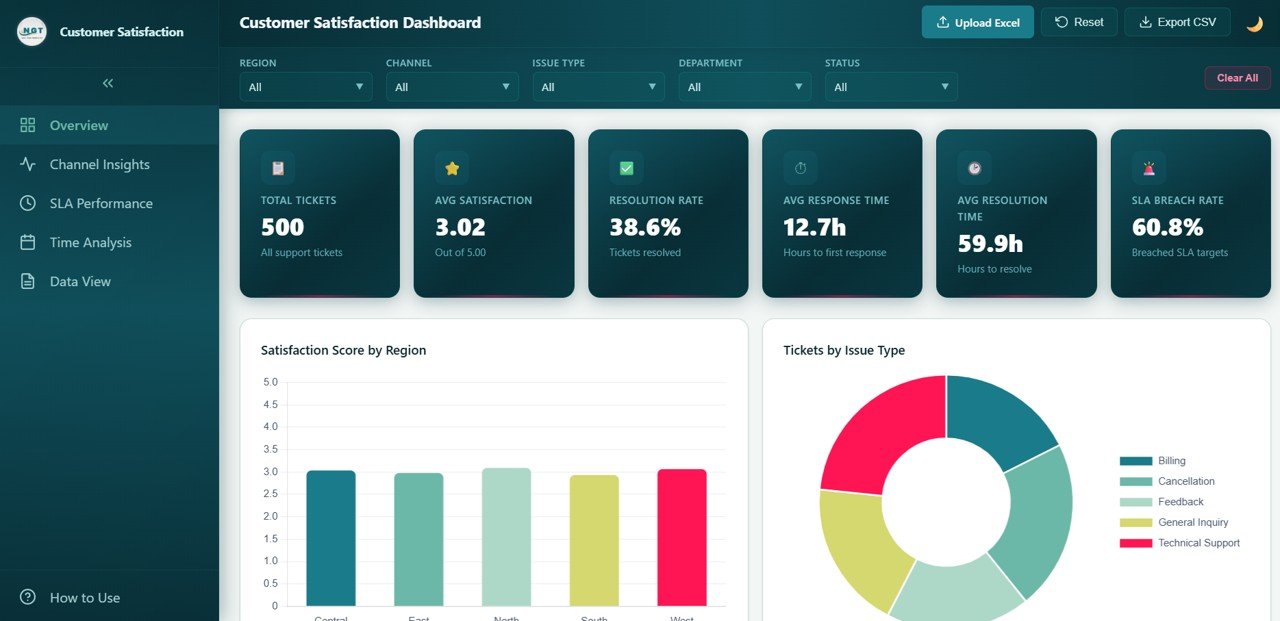
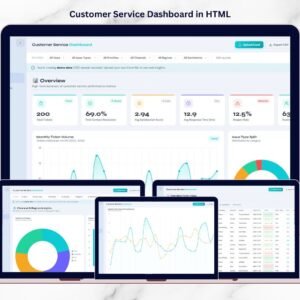
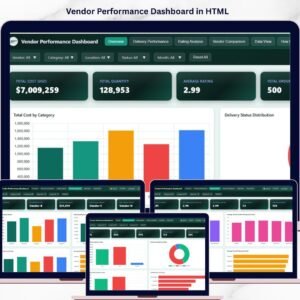
📌 Overview Page — High-level KPI cards showing Total Tickets, Average Satisfaction Score, Resolution Rate, Average Response Time, Average Resolution Time, and SLA Breach Rate. Charts include Satisfaction Score by Region showing how customer happiness varies geographically, Tickets by Issue Type breaking down the most common complaint categories, Tickets by Department revealing workload distribution across teams, Ticket Status Distribution displaying the proportion of open, closed, and pending tickets, and Satisfaction Score by Department comparing service quality across organizational units. Multiple slicers allow filtering for instant targeted analysis.
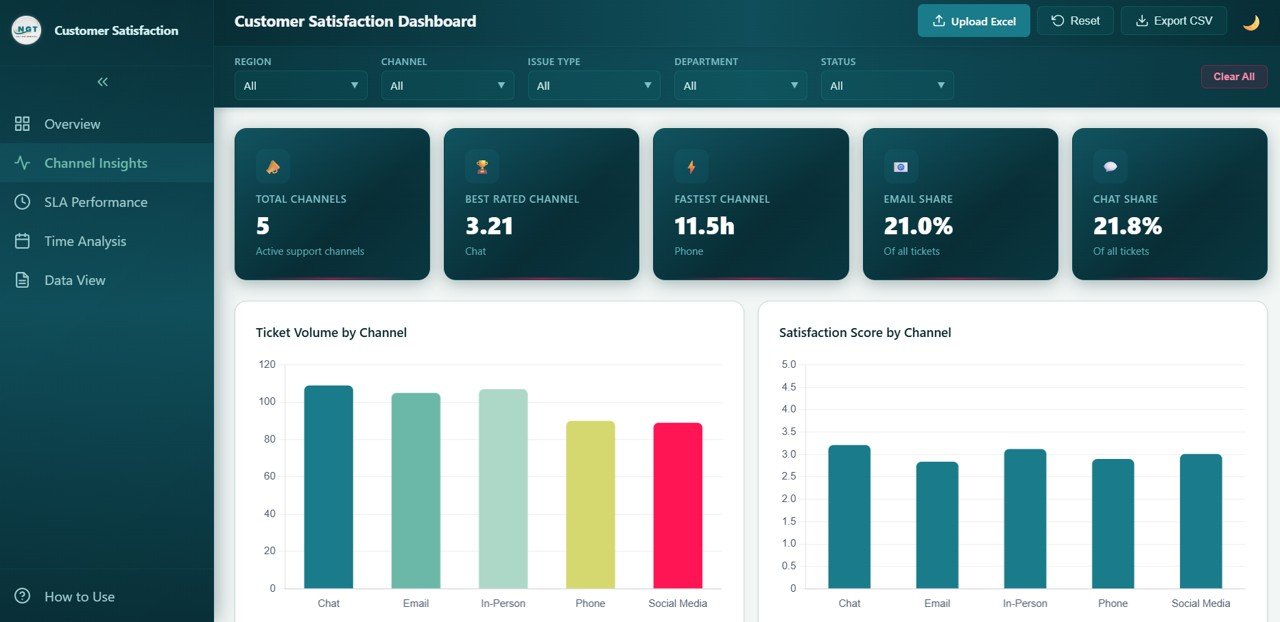
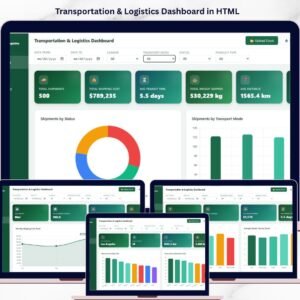
📌 Channel Insights Page — Deep-dive analysis showing Ticket Volume by Channel revealing which support channels receive the most inquiries, Satisfaction Score by Channel comparing customer happiness across phone, email, chat, and social media, Response Time by Channel identifying which channels deliver the fastest initial replies, Resolution Time by Channel measuring end-to-end issue closure speed per channel, and SLA Breach Rate by Channel highlighting which channels struggle most with service level agreements.
 Channel Insights
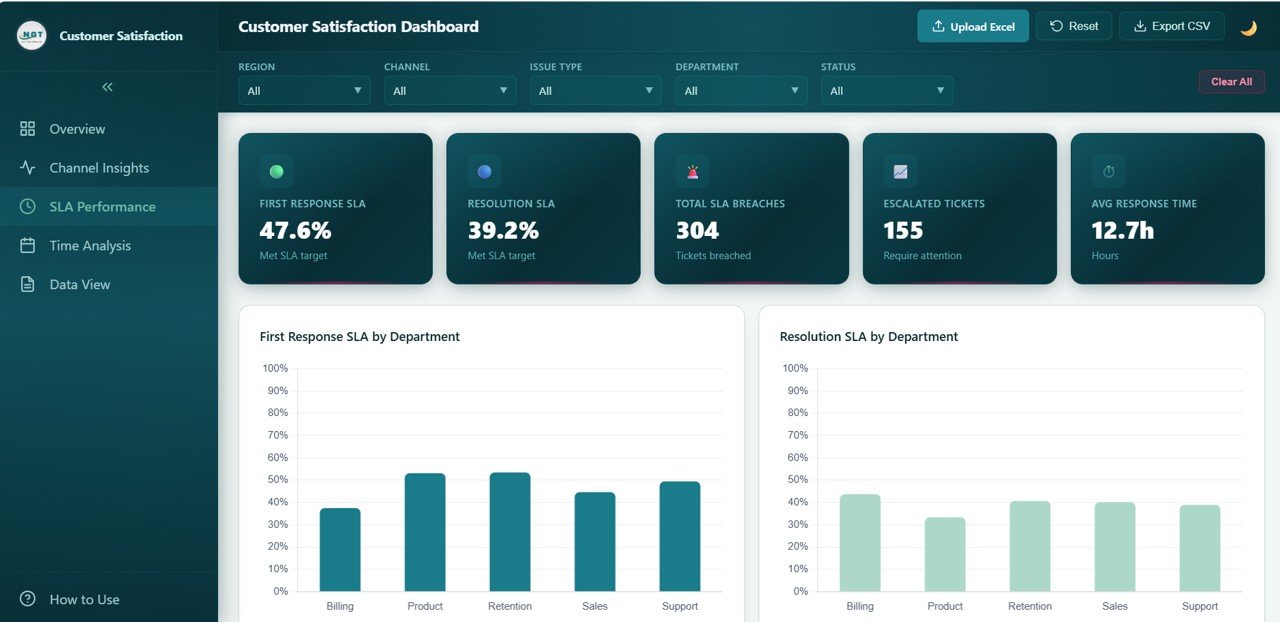
📌 SLA Performance Page — Evaluate service level compliance with charts such as First Response SLA by Department tracking how quickly each team responds to initial customer contact, Resolution SLA by Department measuring end-to-end resolution compliance per team, SLA Breach Rate by Region identifying geographic locations with the most SLA violations, SLA Breach Rate by Issue Type revealing which problem categories cause the most breaches, and Response vs Resolution Time by Department comparing speed of first reply against total resolution duration across departments.
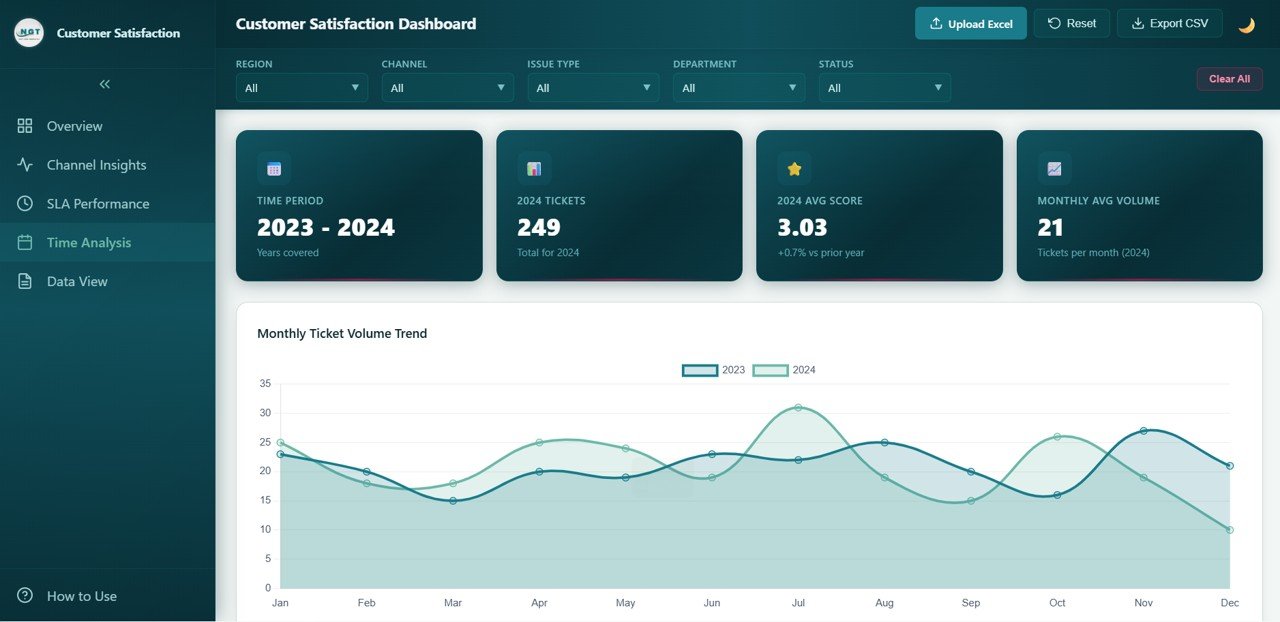
📌 Time Analysis Page — Time-based analysis showing Monthly Ticket Volume Trend tracking how support demand fluctuates over time, Monthly Satisfaction Trend revealing whether customer happiness is improving or declining, Ticket Volume by Year comparing annual workload growth, and Monthly SLA Breach Rate Trend spotting seasonal patterns in service level compliance to help plan staffing and resource allocation.
 Time Analysis
📌 Data View Page — A detailed data table page where you can view all records with search, sort, and pagination features. You can also export the filtered data to CSV for further analysis and auditing.
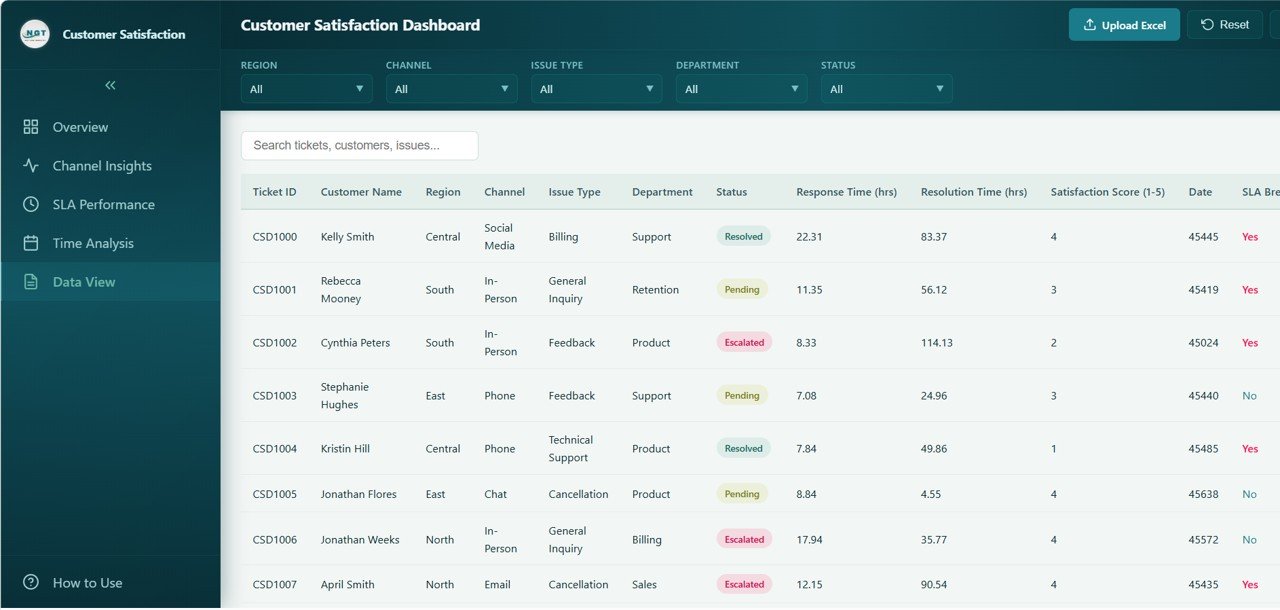 Data View
⚙️ How to Use the Customer Satisfaction Dashboard in HTML
1️⃣ Download the Template — Purchase and download the ZIP file containing the HTML dashboard.
2️⃣ Extract and Open — Unzip the file and open the HTML file in any modern browser like Chrome, Firefox, Edge, or Safari.
3️⃣ Explore the Dashboard — Navigate through the five tabs (Overview, Channel Insights, SLA Performance, Time Analysis, Data View) to explore different analytical views.
4️⃣ Customize Your Data — Replace the sample data with your actual customer feedback and ticket data to get real-time satisfaction insights.
5️⃣ Apply Filters — Use the built-in slicers and filters to narrow down your analysis by department, channel, region, issue type, and date range.
6️⃣ Export and Share — Export detailed data from the Data View page and share the dashboard file with your team for collaborative decision making.
👥 Who Can Benefit from This Customer Satisfaction Dashboard in HTML
📞 Customer Service Managers — Monitor satisfaction scores, SLA compliance, resolution times, and department performance from a single view.
📊 Quality Assurance Teams — Track satisfaction trends, identify SLA breach patterns, and measure the impact of process improvements.
💼 Business Owners and Executives — Get a high-level overview of customer happiness, ticket volumes, and service level metrics for strategic planning.
🎓 Students and Educators — Use this as a learning tool or project submission for data analytics and customer experience management courses.
📈 Marketing and CX Professionals — Leverage satisfaction and channel data to improve customer journeys and increase retention rates.
🏢 Contact Center Supervisors — Evaluate channel performance, response times, SLA compliance, and ticket resolution across teams and locations.
📖 Click here to read the Detailed Blog Post
Watch the step-by-step video tutorial:


Reviews
There are no reviews yet.