
The cosmetics and skincare industry never slows down. New products launch every month, customer expectations shift quickly, and competition keeps increasing. In such a fast-paced environment, relying on static Excel reports makes performance tracking slow and reactive. Cosmetics and Skincare KPI Dashboard in Power BI That is why modern beauty brands need interactive, real-time insights instead of manual reporting.
Cosmetics and Skincare KPI Dashboard in Power BI the Cosmetics and Skincare KPI Dashboard in Power BI is a ready-to-use analytics solution designed to help beauty businesses track KPIs visually, monitor targets, and analyze trends instantly. This dashboard converts Excel data into dynamic KPI cards, interactive tables, slicers, and trend charts, all in one centralized Power BI report.
With automated refresh, drill-through analysis, and clear KPI definitions, this dashboard empowers decision-makers to act faster, smarter, and with confidence.
🚀 Key Features of the Cosmetics and Skincare KPI Dashboard in Power BI
✨ 3 Professionally Designed Power BI Pages for focused analysis
📊 MTD & YTD KPI Tracking to monitor short-term and long-term performance
🎯 Target vs Actual Comparison to identify gaps instantly
📅 Previous Year Performance Analysis for growth comparison
🧮 Interactive KPI Cards showing target met and missed counts
🎛️ Month & KPI Group Slicers for dynamic filtering
📈 MTD & YTD Trend Combo Charts for performance movement
🔍 Drill-Through KPI Definition Page for deeper understanding
Each feature is designed to eliminate guesswork and provide clear, actionable insights at a glance.
📦 What’s Inside the Cosmetics and Skincare KPI Dashboard in Power BI
This digital product includes a 3-page Power BI Desktop dashboard, supported by a structured Excel data source.
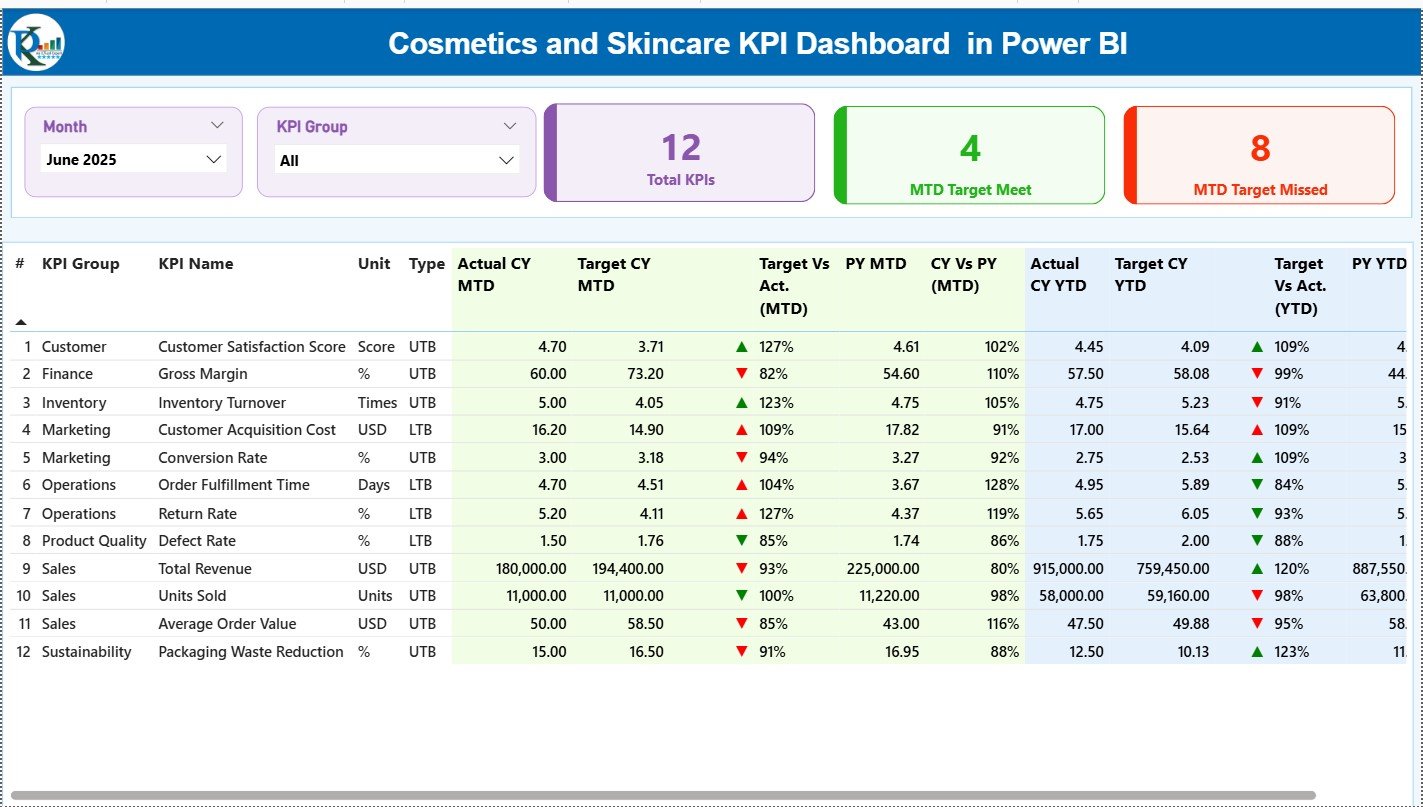
📌 Summary Page
The main landing page showing a complete snapshot of KPI performance. It includes Month and KPI Group slicers, 3 KPI cards, and a detailed KPI table with MTD and YTD analysis, icons, and comparison ratios.
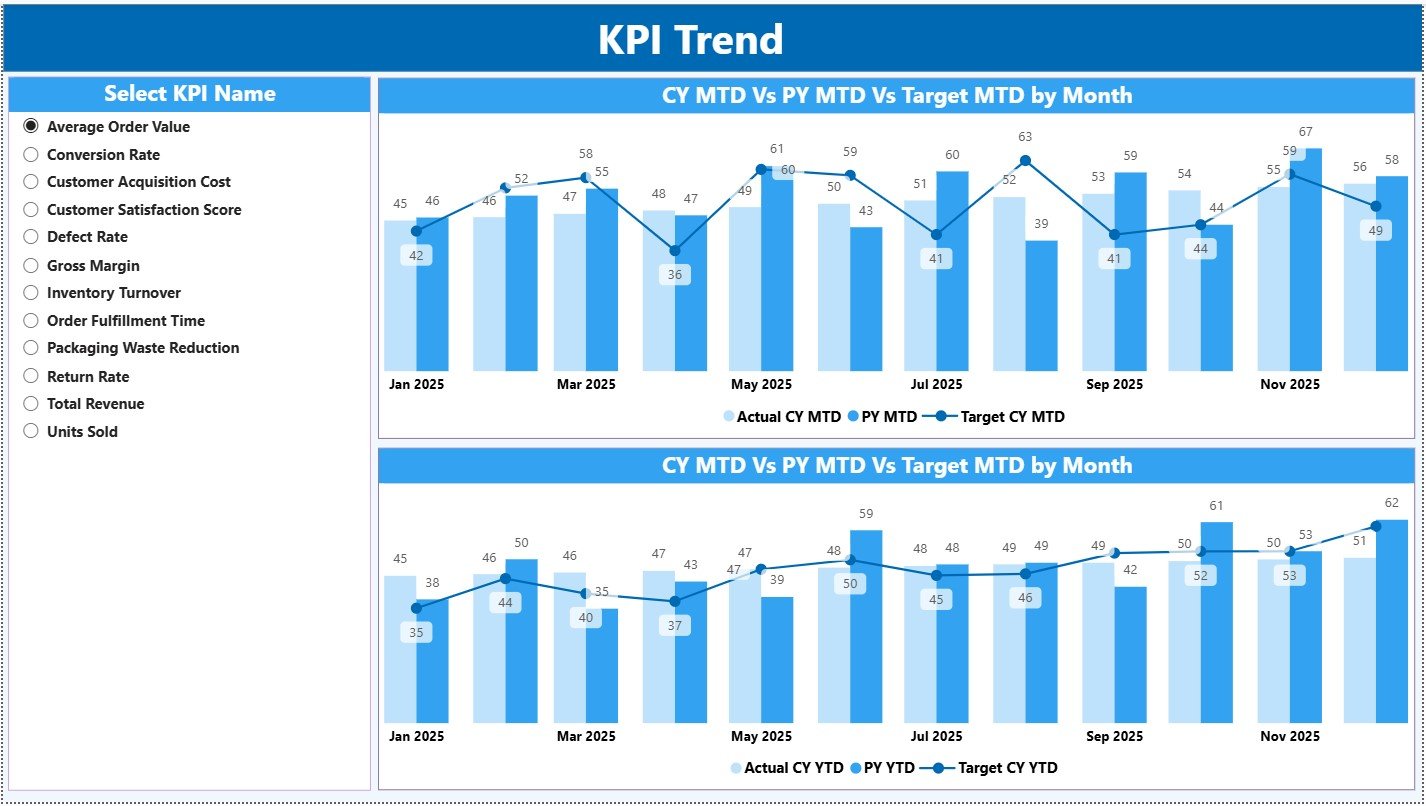
📈 KPI Trend Page
This page focuses on trend analysis. Users select a KPI from a slicer, and the dashboard displays MTD and YTD combo charts comparing Actual, Target, and Previous Year values.
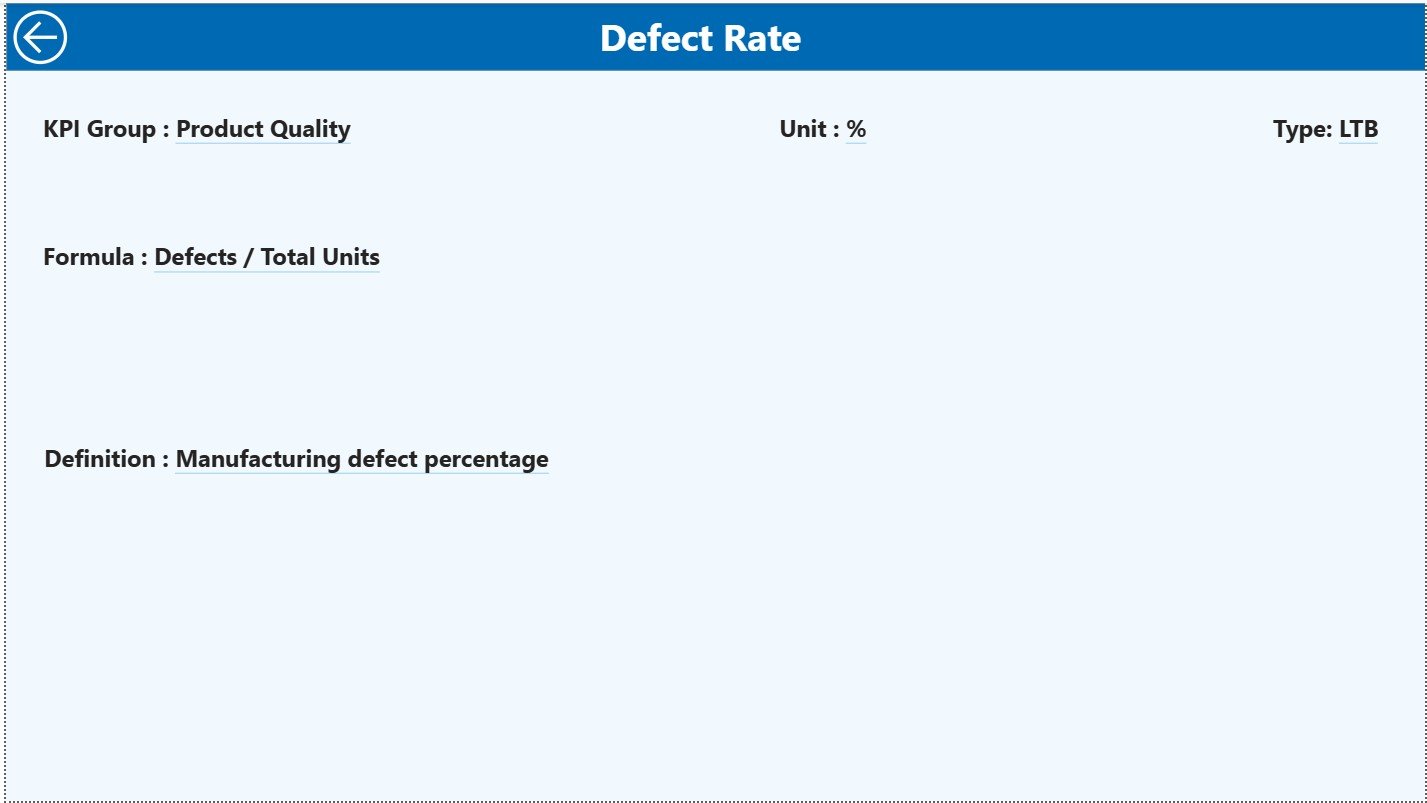
📘 KPI Definition Page (Drill-Through)
A hidden drill-through page that displays KPI formula, definition, and context. Users access it directly from the Summary Page, ensuring transparency and clarity.
📊 Excel Data Source (3 Worksheets)
-
Input Actual – Stores MTD and YTD actual values
-
Input Target – Stores MTD and YTD target values
-
KPI Definition – Master reference for KPIs, units, formulas, and types
This structure ensures accuracy, scalability, and easy maintenance.
🧭 How to Use the Cosmetics and Skincare KPI Dashboard in Power BI
Using this dashboard is simple and business-friendly:
1️⃣ Update KPI definitions in the Excel file
2️⃣ Enter monthly actual and target values
3️⃣ Refresh the Power BI report
4️⃣ Use slicers to filter by Month or KPI Group
5️⃣ Analyze performance using cards, tables, and trend charts
No complex modeling. No heavy technical setup. Just clean data and powerful visuals.
👥 Who Can Benefit from This Cosmetics and Skincare KPI Dashboard
This dashboard is ideal for:
💄 Cosmetics Brand Owners tracking business performance
🧴 Skincare Product Managers monitoring quality and sales KPIs
📊 Sales & Marketing Teams analyzing campaign effectiveness
🏭 Operations Managers improving efficiency
💰 Finance & Planning Teams supporting strategic decisions
Whether you manage a startup beauty brand or a growing cosmetics company, this dashboard adapts effortlessly.
🔗 Click here to read the Detailed blog post
🎥 Visit our YouTube channel to learn step-by-step video tutorials
👉 Youtube.com/@PKAnExcelExpert
Watch the step-by-step video tutorial:


Reviews
There are no reviews yet.