Contracts are more than legal documents—they directly impact compliance, revenue, risk, and operational efficiency. However, when contract data is managed through scattered Excel files, emails, or static reports, visibility drops fast. As a result, organizations miss targets, overlook risks, and struggle to make timely decisions.
That is exactly where the Contract Management KPI Dashboard in Power BI becomes a powerful performance intelligence solution.
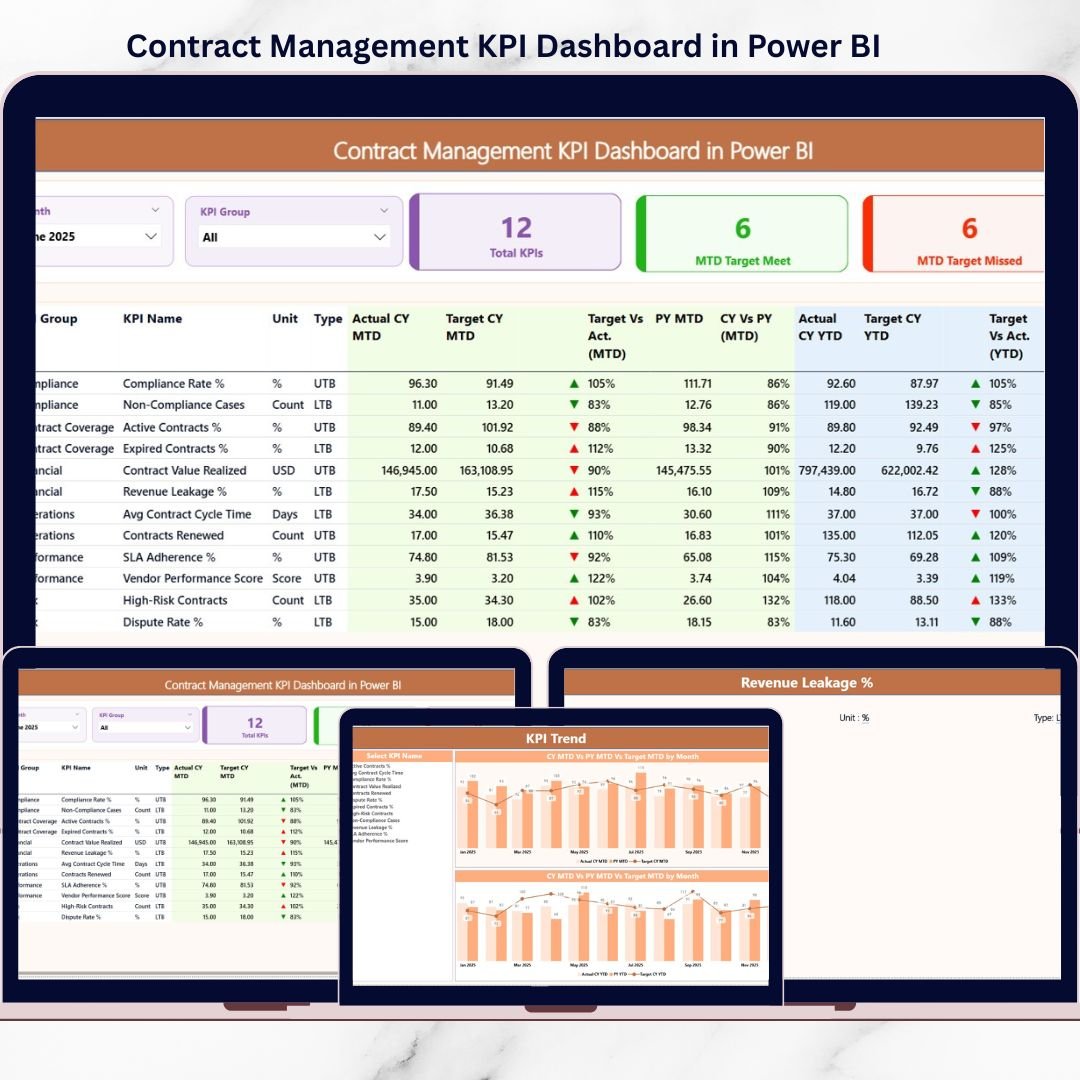
This ready-to-use Power BI dashboard transforms raw contract data into clear, interactive, and actionable insights. Instead of manually reviewing registers, leadership teams can instantly monitor KPIs, track trends, compare targets, and identify risks—all in one centralized dashboard.
Built using Excel as a data source and Power BI for analytics, this dashboard combines simplicity with advanced visualization to help organizations move from reactive contract management to proactive performance control.
🔑 Key Features of Contract Management KPI Dashboard in Power BI
📊 Centralized Contract KPI Monitoring
Track all contract KPIs in one interactive Power BI dashboard with a single source of truth.
🎯 MTD & YTD Performance Tracking
Monitor Month-to-Date and Year-to-Date performance for every contract KPI.
🔁 Target vs Actual Comparison
Instantly identify which KPIs meet targets and which ones are missed.
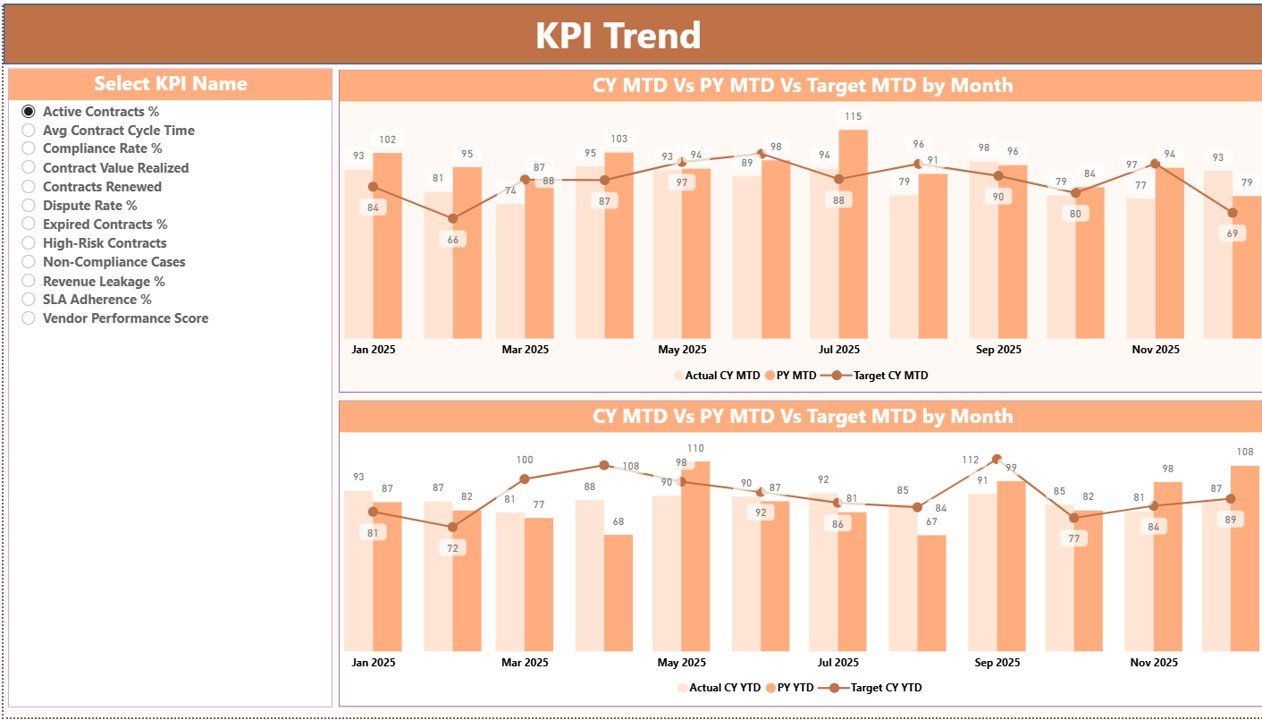
📈 KPI Trend Analysis
Analyze performance trends using MTD and YTD combo charts for current year, previous year, and targets.
🎨 Visual KPI Status Indicators
Red and green icons clearly show KPI health without digging into numbers.
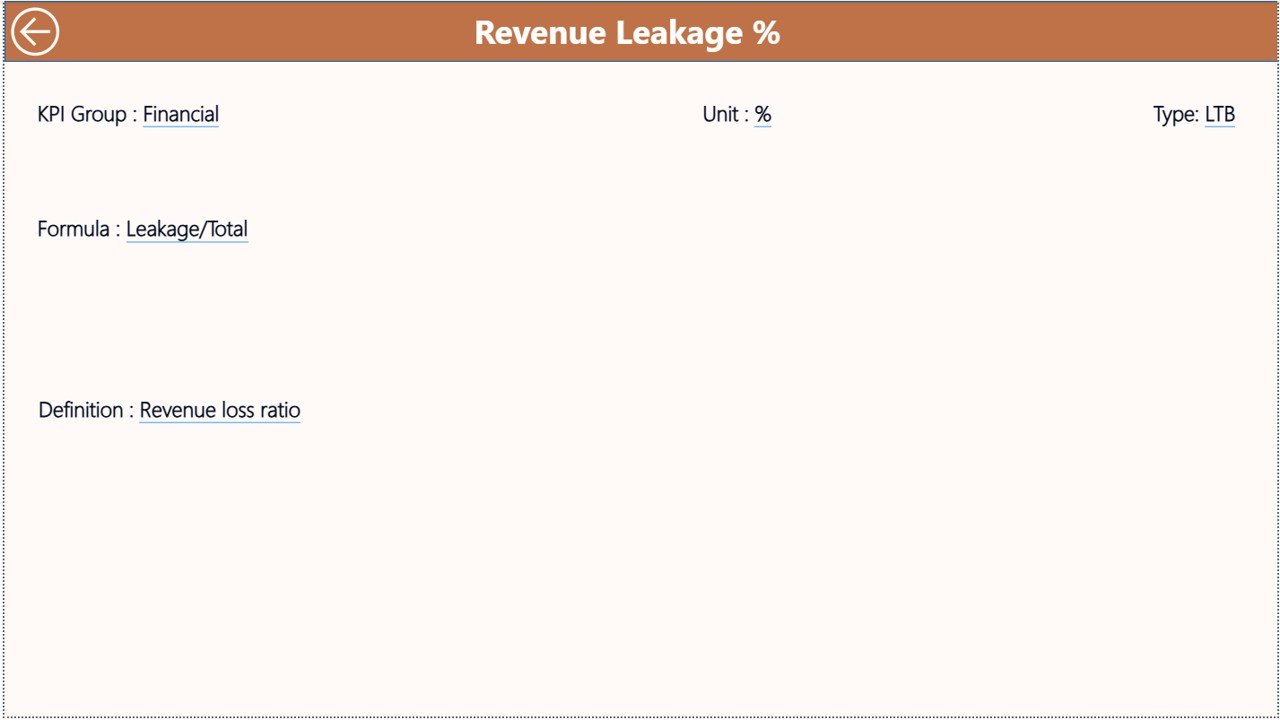
🔍 Drill-Through KPI Definitions
Click and drill into KPI formulas and definitions for complete clarity.
📦 What’s Inside the Contract Management KPI Dashboard in Power BI
This professionally designed Power BI solution includes three analytical pages and a structured Excel data source.
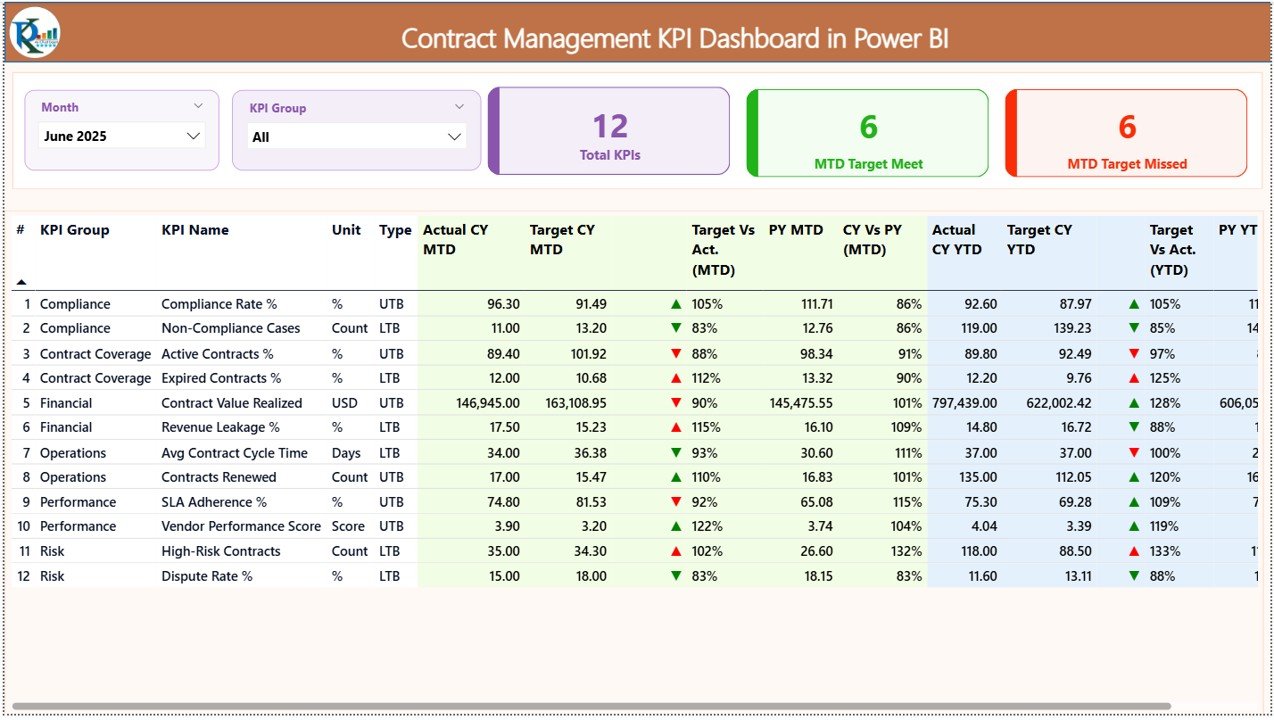
📊 Summary Page – Overall KPI Performance
-
Interactive slicers for Month and KPI Group
-
KPI cards showing total KPIs, targets met, and targets missed
-
Detailed KPI table with MTD, YTD, target, previous year, and variance
-
Visual status icons for quick decision-making
📈 KPI Trend Page – Performance Movement Analysis
-
KPI selection slicer
-
MTD combo chart (Actual, Target, Previous Year)
-
YTD combo chart (Actual, Target, Previous Year)
-
Clear visibility into performance trends
📋 KPI Definition Page – Drill-Through Details
-
KPI Formula
-
KPI Definition
-
KPI context and logic
-
Easy back navigation
🗂 Excel Data Source (3 Sheets)
-
Input Actual: Actual MTD and YTD values
-
Input Target: Target MTD and YTD values
-
KPI Definition: KPI structure, unit, formula, and type
⚙️ How to Use the Contract Management KPI Dashboard in Power BI
Using this dashboard is simple and efficient:
1️⃣ Update actual KPI values in the Excel Input Actual sheet
2️⃣ Enter targets in the Input Target sheet
3️⃣ Maintain KPI structure in the KPI Definition sheet
4️⃣ Refresh Power BI
5️⃣ Use slicers to analyze MTD, YTD, and trends instantly
No complex modeling, no coding—just refresh and analyze.
👥 Who Can Benefit from This Contract Management KPI Dashboard
This dashboard is ideal for:
📑 Contract managers
⚖️ Legal & compliance teams
🛒 Procurement professionals
💰 Finance & audit teams
🏢 Senior leadership
Anyone with basic Power BI knowledge can use this dashboard confidently.
🚀 Why Choose This Contract Management KPI Dashboard?
✅ Real-time KPI visibility
✅ Stronger compliance tracking
✅ Faster risk identification
✅ Automated performance analysis
✅ Scalable and business-ready
Stop relying on static reports. Start managing contracts with interactive intelligence.
📘 Click here to read the Detailed blog post
🎥 Visit our YouTube channel to learn step-by-step video tutorials


Reviews
There are no reviews yet.