Managing community services is no small task. From healthcare and education to housing and volunteer programs, organizations must balance multiple priorities while ensuring accountability and transparency. Traditional spreadsheets often fall short—leaving teams stuck in manual calculations and scattered reports.
✨ That’s where the Community Services KPI Dashboard in Excel steps in. It’s not just a reporting tool—it’s your all-in-one performance tracking partner. This prebuilt, interactive Excel template helps you monitor KPIs, analyze results, and make informed decisions with just a few clicks. Whether you’re a community leader, NGO manager, or volunteer coordinator, this dashboard simplifies data management so you can focus on creating real impact.
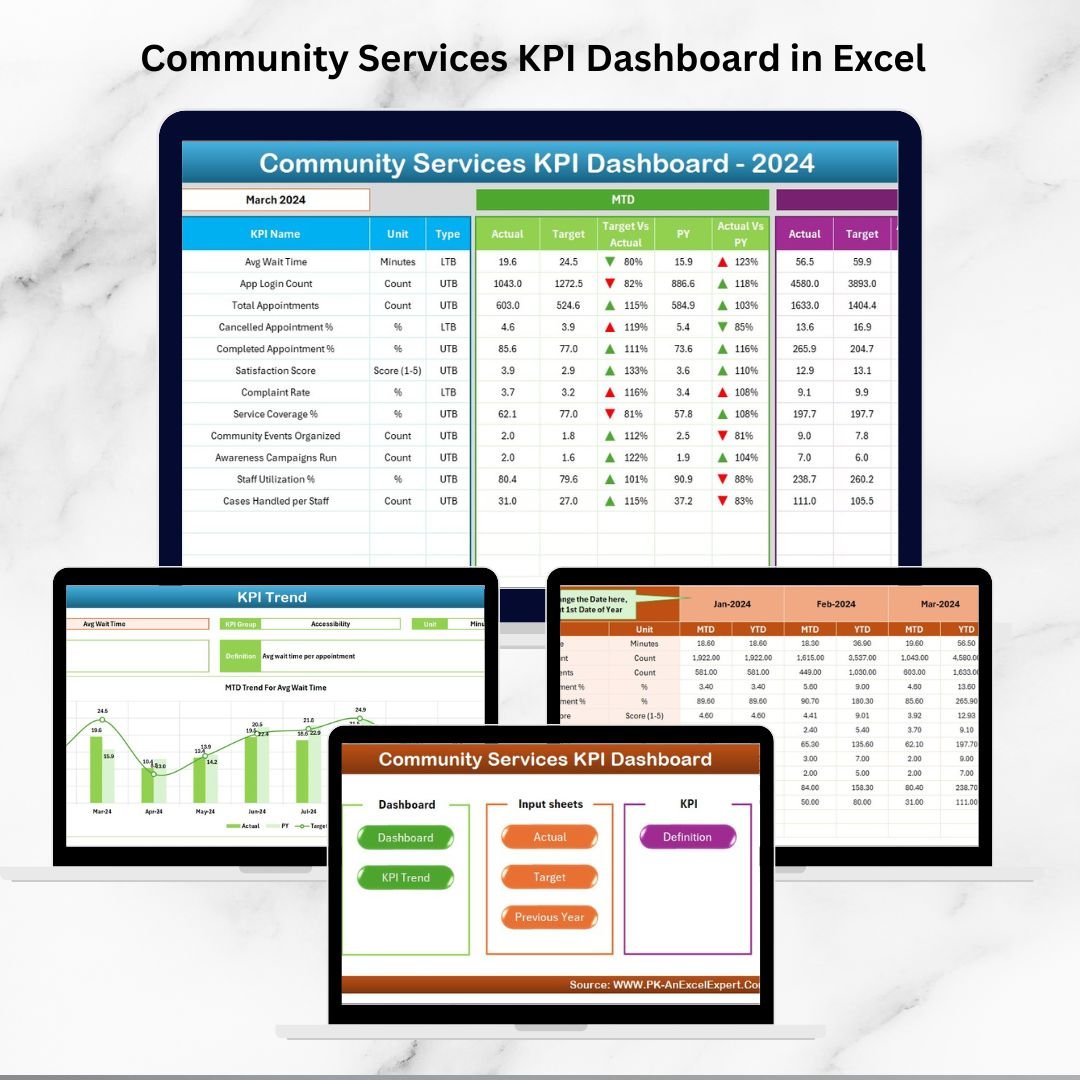
✅ Key Features of the Community Services KPI Dashboard in Excel
-
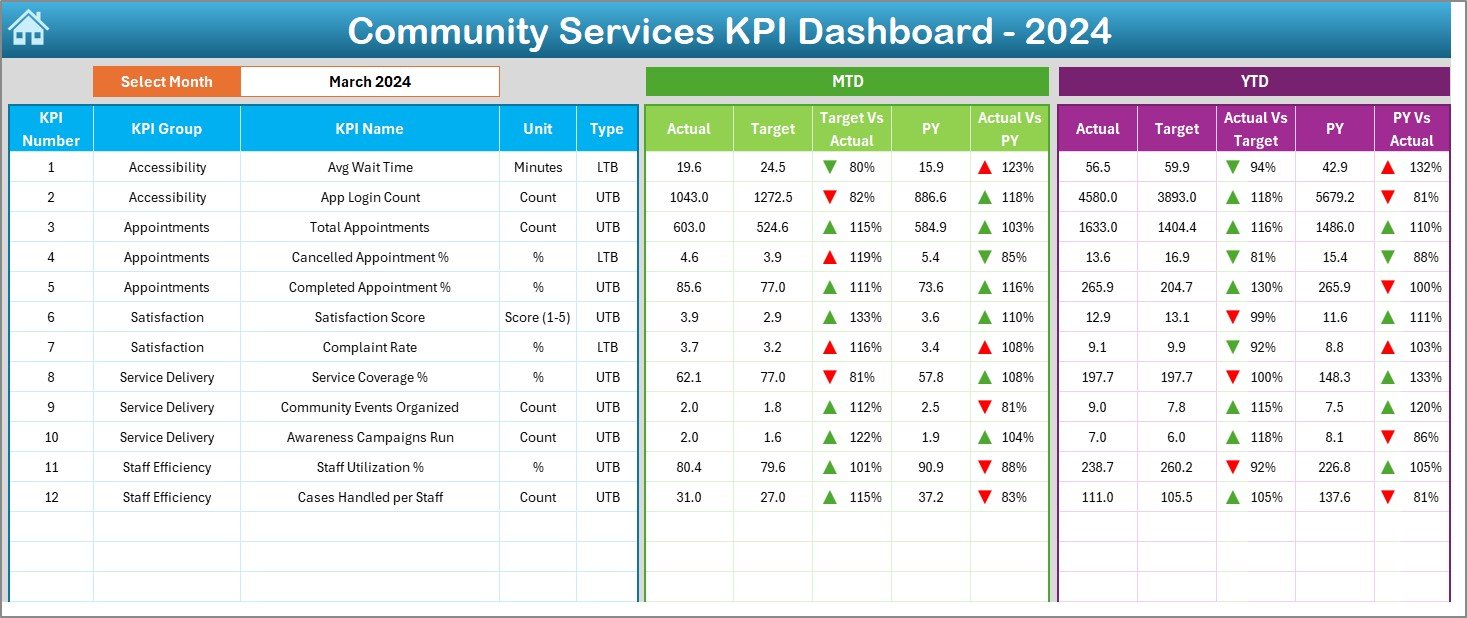
📊 Centralized Dashboard – Track all KPIs (MTD & YTD) in one place.
-
🎯 Target vs. Actual Comparison – Instantly view performance against goals.
-
🔄 Dynamic Filters & Slicers – Switch between months for real-time insights.
-
📈 Trend Analysis – Visual charts for Actual, Target, and Previous Year data.
-
🟢 Conditional Formatting – Green/red arrows highlight achievements or risks.
-
🗂 Structured Data Sheets – Includes Actual Numbers, Targets, Previous Year, and KPI Definition tabs.
-
⏱ Time-Saving Automation – No more manual reporting headaches.
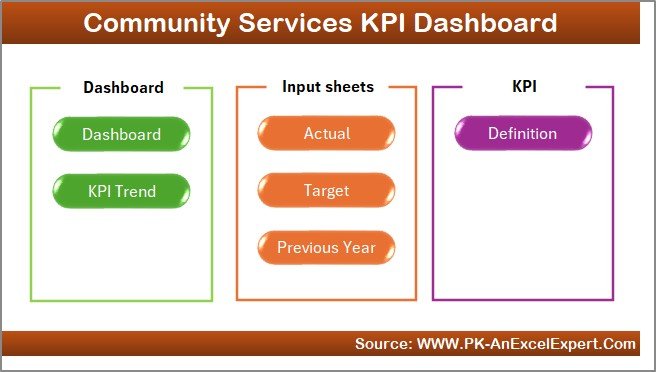
📂 What’s Inside the Community Services KPI Dashboard
When you download this template, you’ll get seven professionally designed worksheets:
-
🏠 Home Sheet – Quick navigation with six buttons to access sections instantly.
-
📊 Dashboard Tab – The main hub with all KPIs, MTD/YTD performance, and arrows for progress tracking.
-
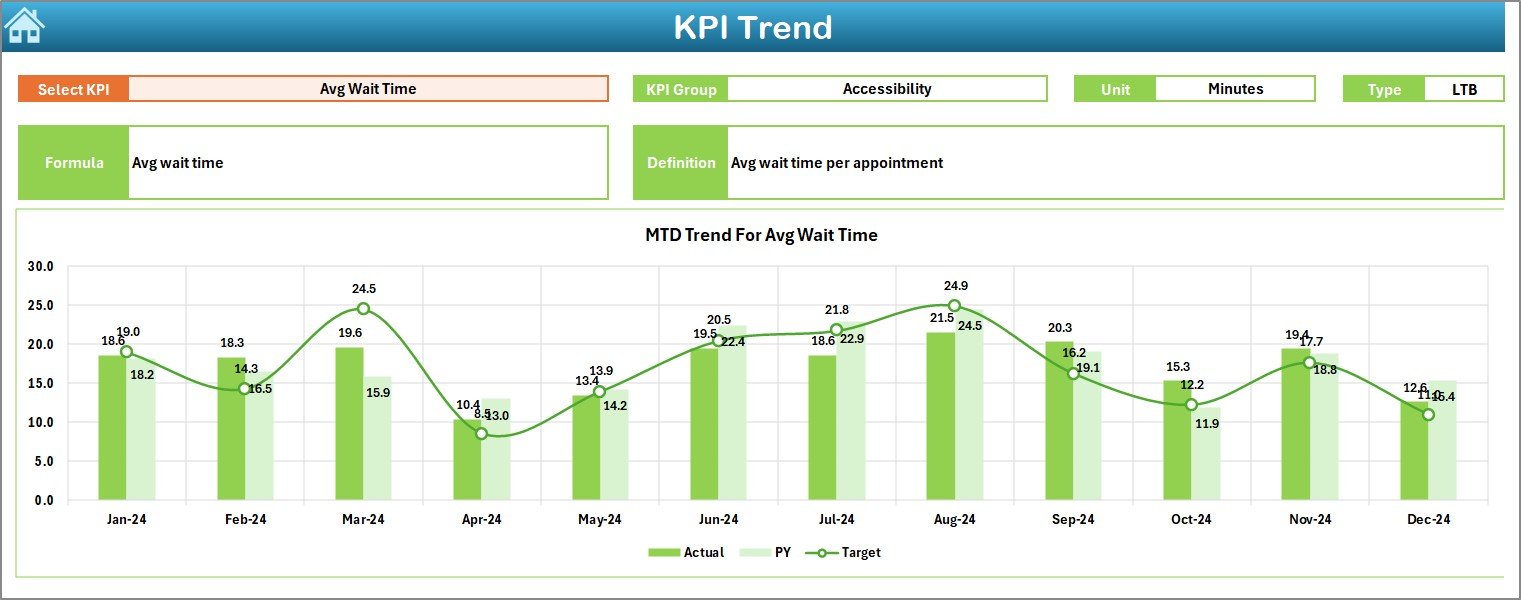
📈 KPI Trend Sheet – Drop-down selection to view trends of any KPI with charts and definitions.
-
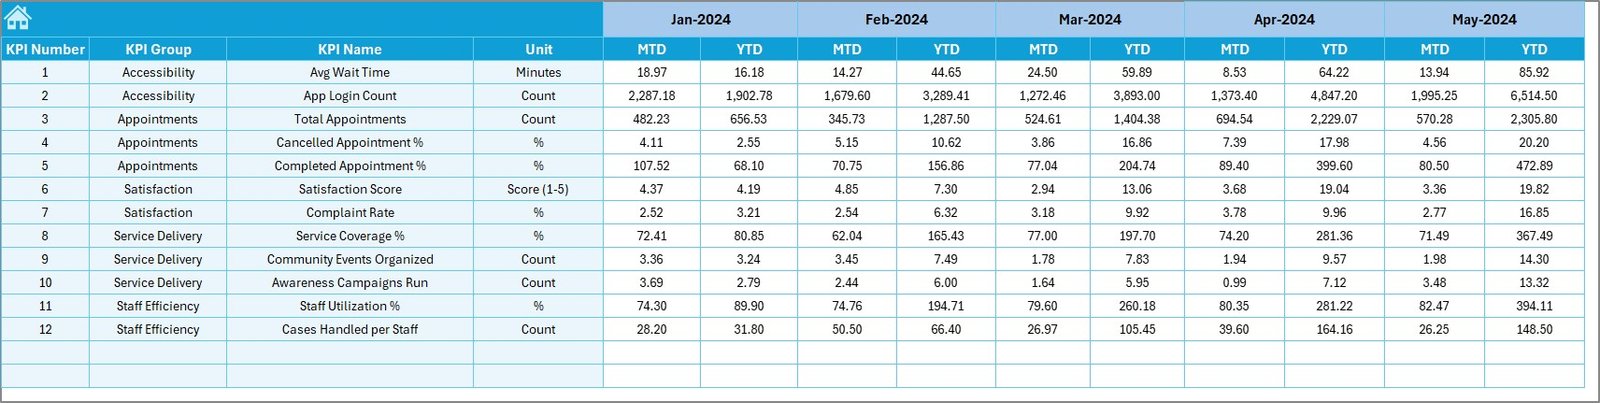
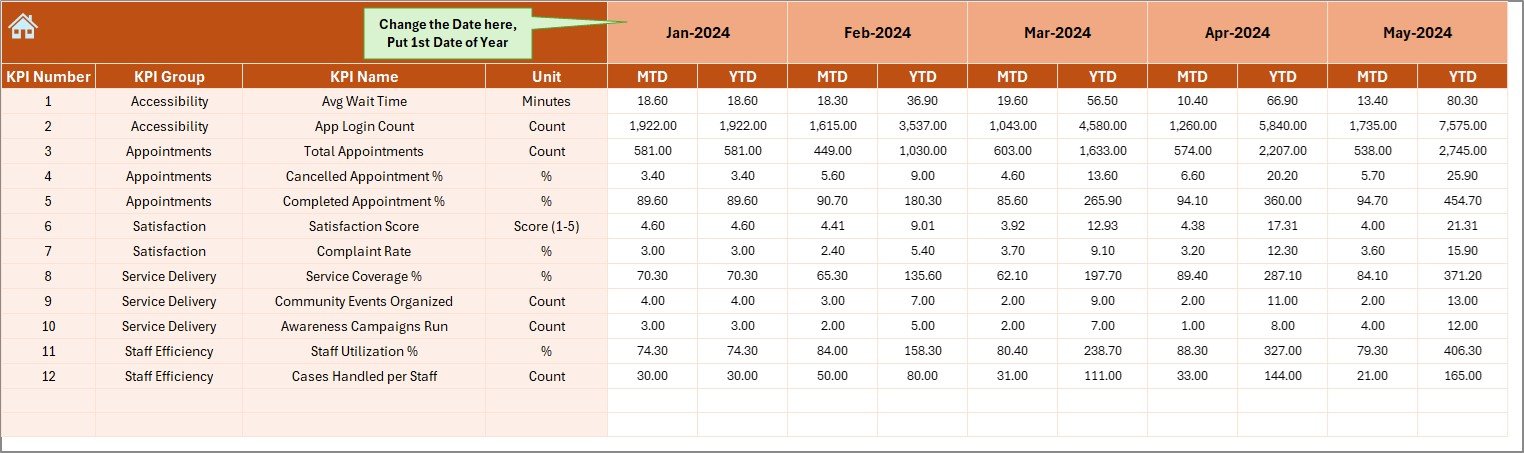
✍ Actual Numbers Input – Enter monthly actual data with ease.
-
🎯 Target Sheet – Store monthly KPI targets to track achievements.
-
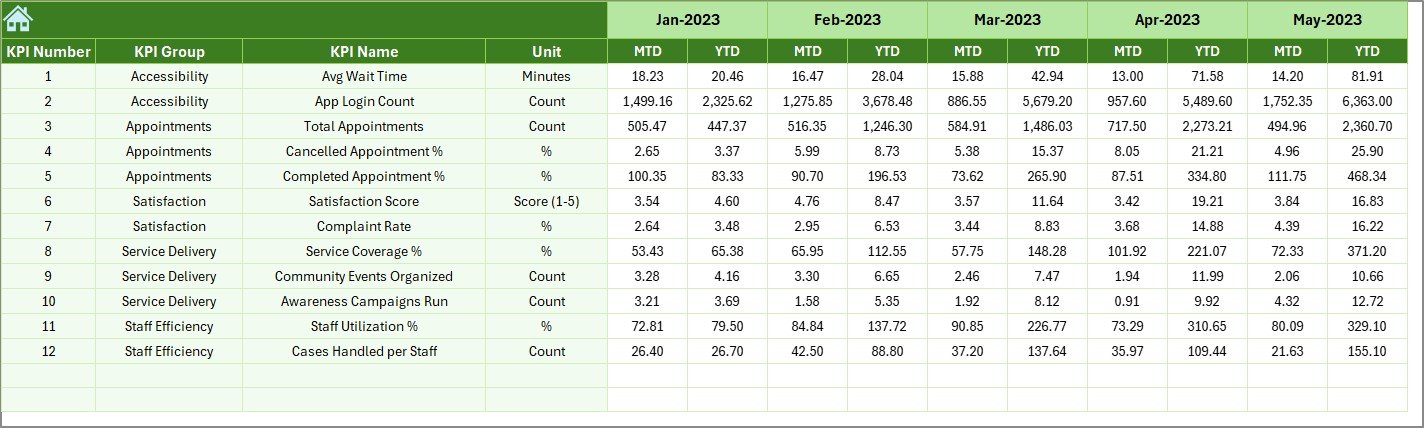
📅 Previous Year Data – Compare year-on-year progress.
-
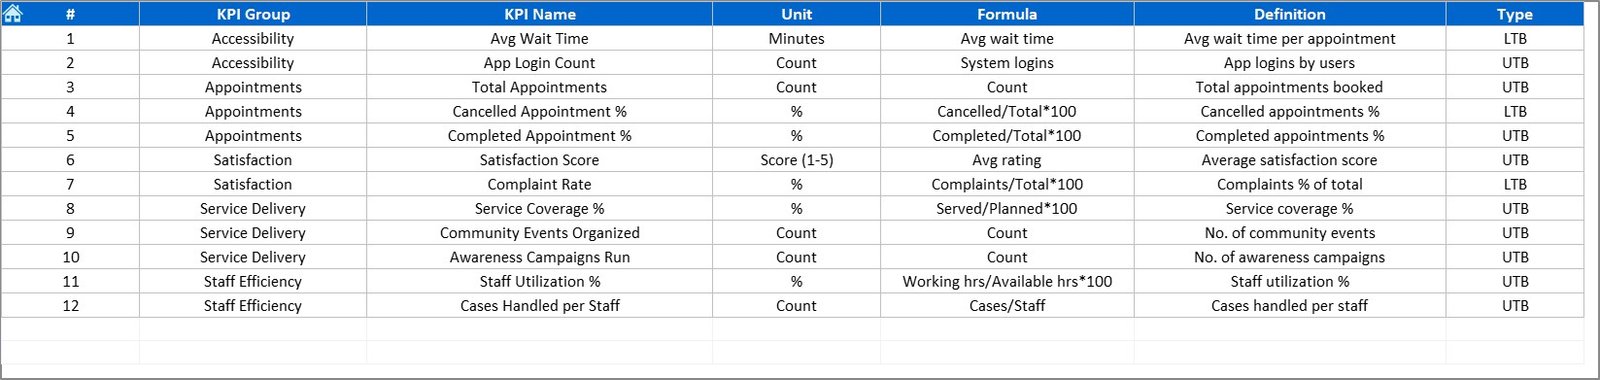
📖 KPI Definition Sheet – Standardize your KPIs with clear definitions, formulas, and units.
🚀 How to Use the Community Services KPI Dashboard
-
Enter Your Data – Input actual performance numbers in the “Actual Numbers” sheet.
-
Set Targets – Define monthly and yearly targets in the “Target” sheet.
-
Select Month – Use the drop-down on the Dashboard tab to choose your reporting period.
-
Analyze Trends – Check charts and arrows for progress tracking.
-
Share Reports – Export your dashboard or share it with stakeholders in seconds.
💡 Even if you only know the basics of Excel, you’ll be able to use this dashboard with confidence.
👥 Who Can Benefit from This Dashboard?
-
🌍 Community Leaders & NGOs – Track program effectiveness and prove accountability to funders.
-
🏥 Healthcare Programs – Monitor patient services, wait times, and satisfaction scores.
-
🎓 Educational Initiatives – Track enrollment, attendance, and completion rates.
-
🏘 Social Welfare Projects – Measure housing, food distribution, and financial aid metrics.
-
🙌 Volunteer Management Teams – Track participation, hours, and retention.
-
🎉 Event Planners – Measure attendance, participant feedback, and cost efficiency.
With this tool, you’ll save time, reduce reporting errors, and improve community outcomes.
📖 Click here to read the Detailed blog post
Visit our YouTube channel to learn step-by-step video tutorials 👉 PKAnExcelExpert YouTube Channel


Reviews
There are no reviews yet.