


Coffee Chains Dashboard in Excel is a ready-to-use, fully interactive Excel dashboard designed for coffee business owners, franchise managers, and data analysts who want to monitor sales performance, profitability, and customer satisfaction across multiple coffee chain outlets. This template includes 5 dynamic dashboard pages, a structured data sheet, and a support sheet with pivot tables — all built to auto-refresh when you update your data 📊☕.
Whether you manage a single coffee shop or an entire franchise network, this dashboard gives you instant visibility into revenue trends, profit margins, regional performance, product-level analytics, and customer behavior — all within Microsoft Excel. Explore our full collection of Excel Dashboard Templates for more industry-specific solutions.
 Coffee Chains Dashboard in Excel
🔑 Key Features of Coffee Chains Dashboard in Excel
📌 5 Interactive Dashboard Pages – Overview, Chain Performance, Product Analysis, Regional Insights, and Customer & Channel pages give you 360-degree visibility into your coffee chain operations.
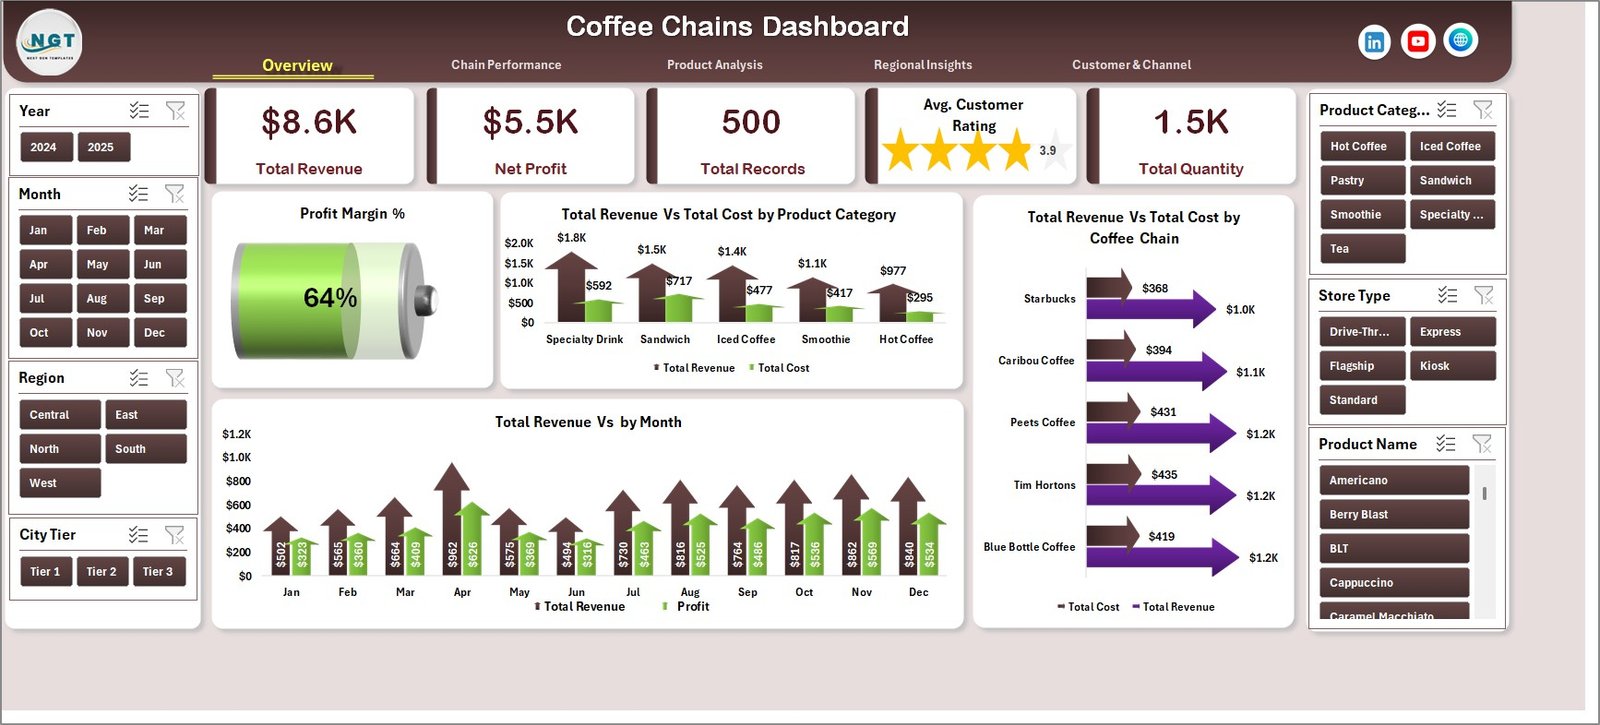
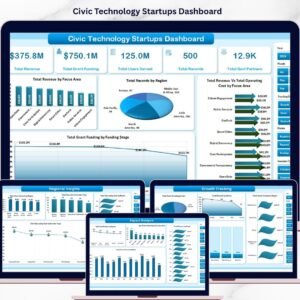
📌 KPI Summary Cards – Instantly view Total Revenue, Net Profit, Total Records, Customer Rating, and Total Quantity at a glance on the Overview page.
📌 Pivot-Powered Dynamic Charts – Every chart is connected to pivot tables. Simply refresh data and all visuals update automatically.
📌 Slicer-Based Filtering – Apply quick filters using built-in slicers on the Overview page to drill down into specific segments instantly.
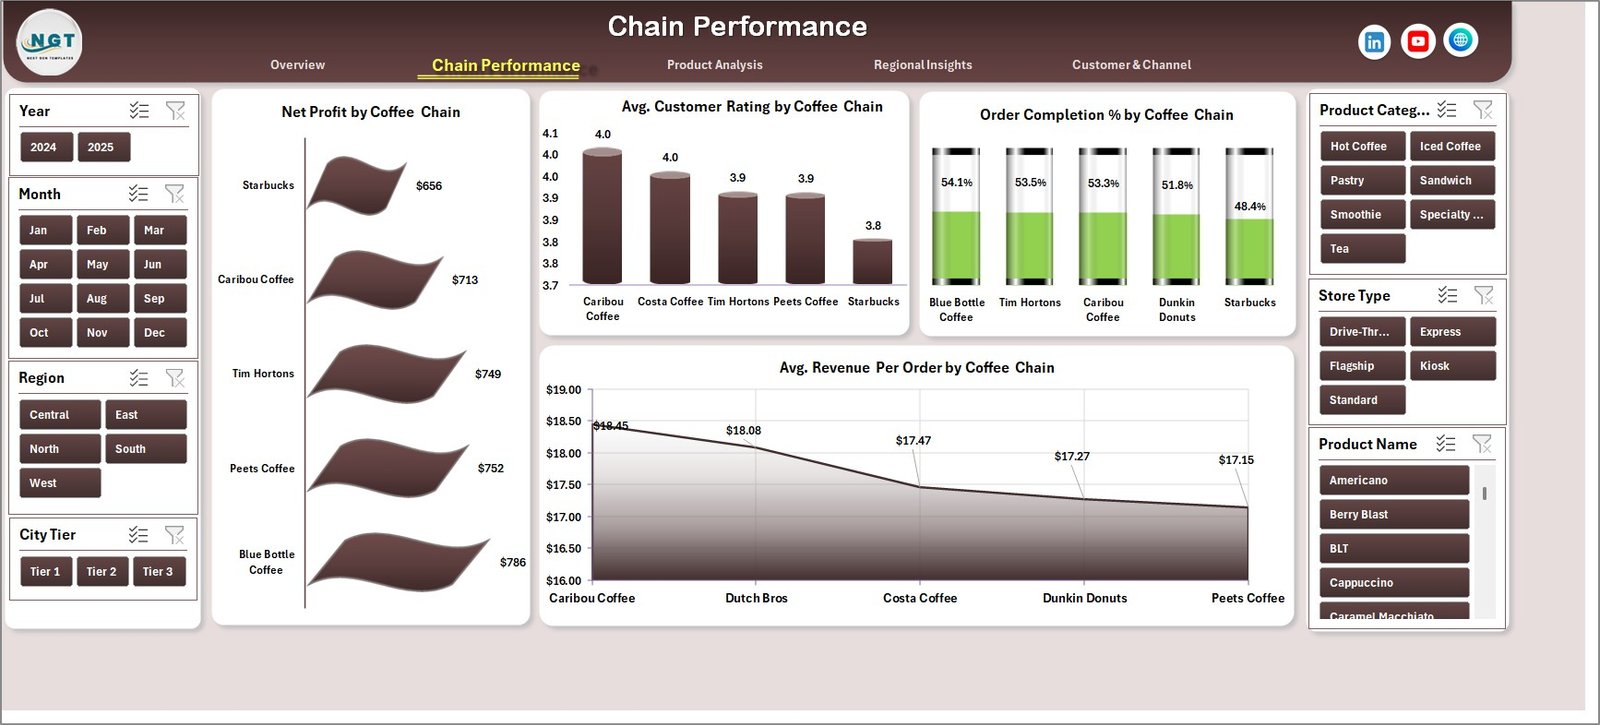
📌 Multi-Chain Comparison – Compare Net Profit, Customer Ratings, Order Completion %, and Average Revenue Per Order across different coffee chains.
📌 Product-Level Profitability – Analyze Total Quantity, Profit Margin %, and Revenue by Product Name and Size to identify your best sellers.
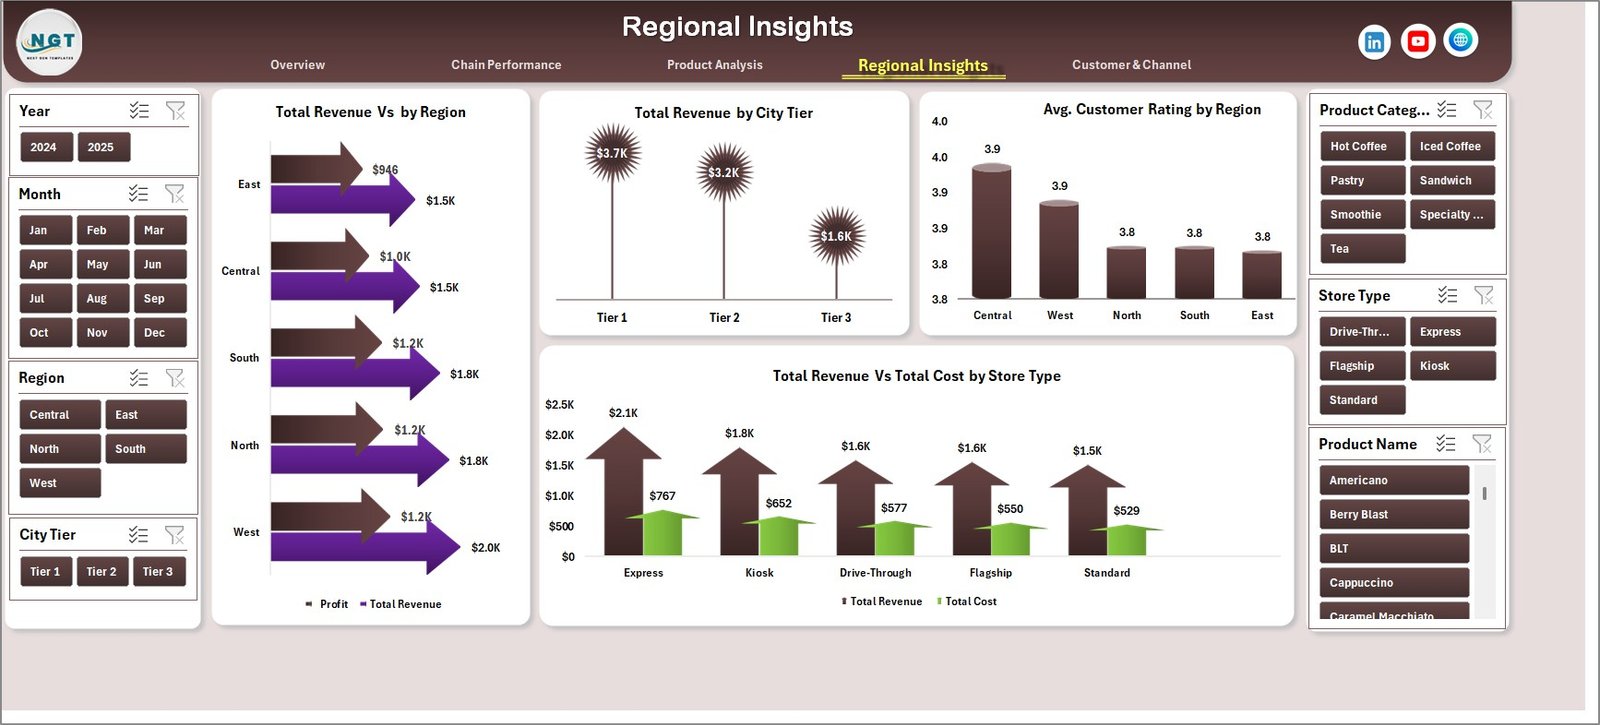
📌 Regional & Store Analytics – View revenue distribution by Region, City Tier, and Store Type alongside customer satisfaction scores.
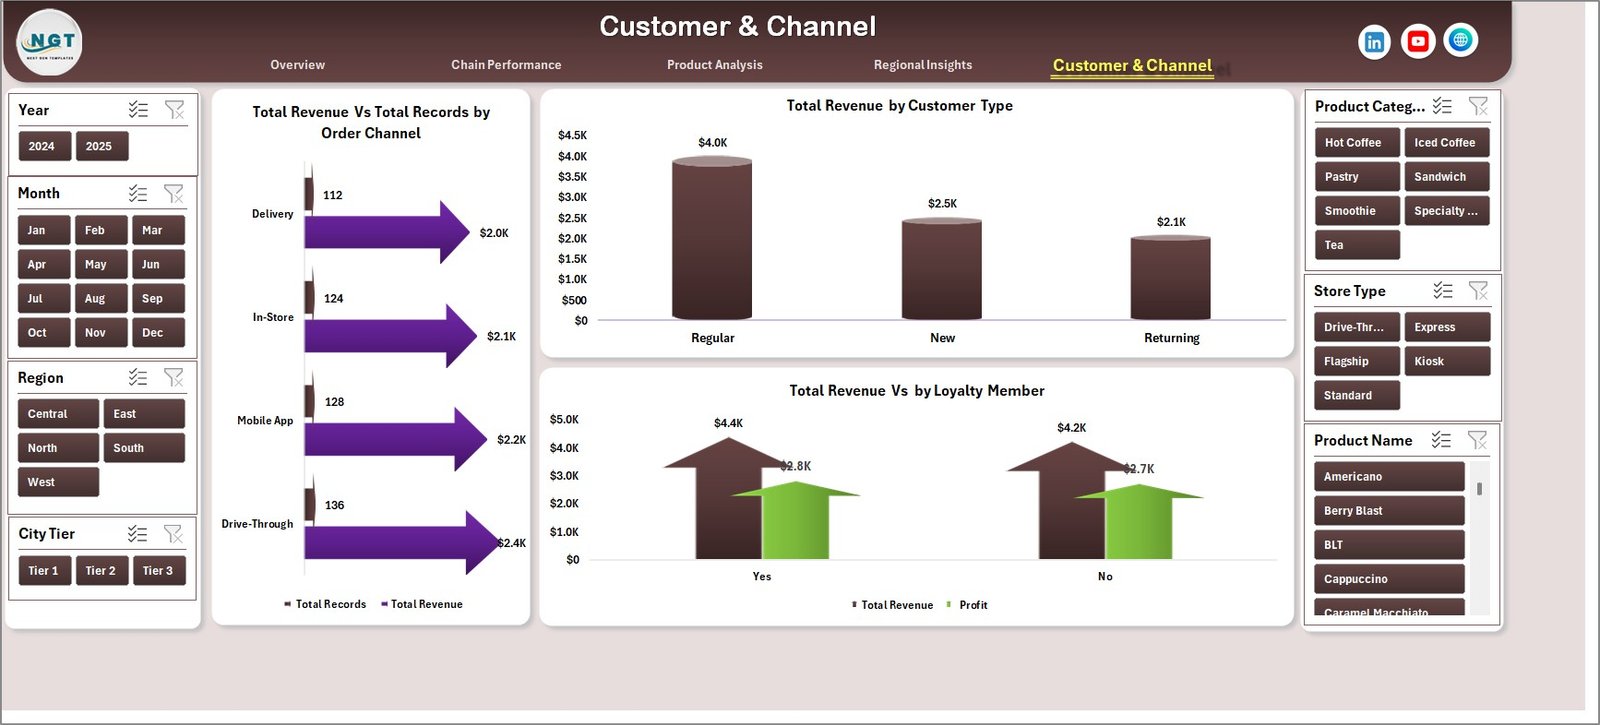
📌 Customer Segmentation – Understand how revenue flows through Order Channels, Customer Types, and Loyalty Membership status.
📌 Plug-and-Play Data Sheet – Simply replace sample data with your own records in the structured Data Sheet and refresh all dashboards with one click.
📌 No VBA or Macros Required – 100% formula and pivot-based. Works in Microsoft Excel without enabling macros.
If you run a food and beverage business, also check out our Food and Beverage Dashboard in Excel and the Restaurants & Food Services KPI Dashboard in Excel for complementary analytics.
📦 What’s Inside the Coffee Chains Dashboard in Excel
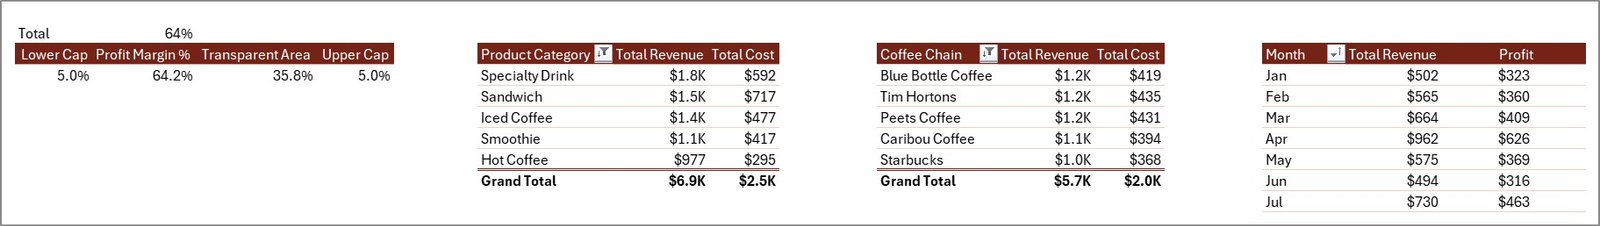
📊 Overview Page – Displays 5 KPI cards (Total Revenue, Net Profit, Total Records, Customer Rating, Total Quantity) alongside visual charts showing Profit Margin % by Overall, Total Revenue Vs Total Cost by Product Category, Total Revenue Vs Total Cost by Coffee Chain, and Total Revenue Vs by Month. Multiple slicers allow instant filtering.
 Chain Performance
📊 Chain Performance Page – Deep-dive into Net Profit by Coffee Chain, Avg. Customer Rating by Coffee Chain, Order Completion % by Coffee Chain, and Avg. Revenue Per Order by Coffee Chain to identify top-performing and underperforming outlets.
 Product Analysis
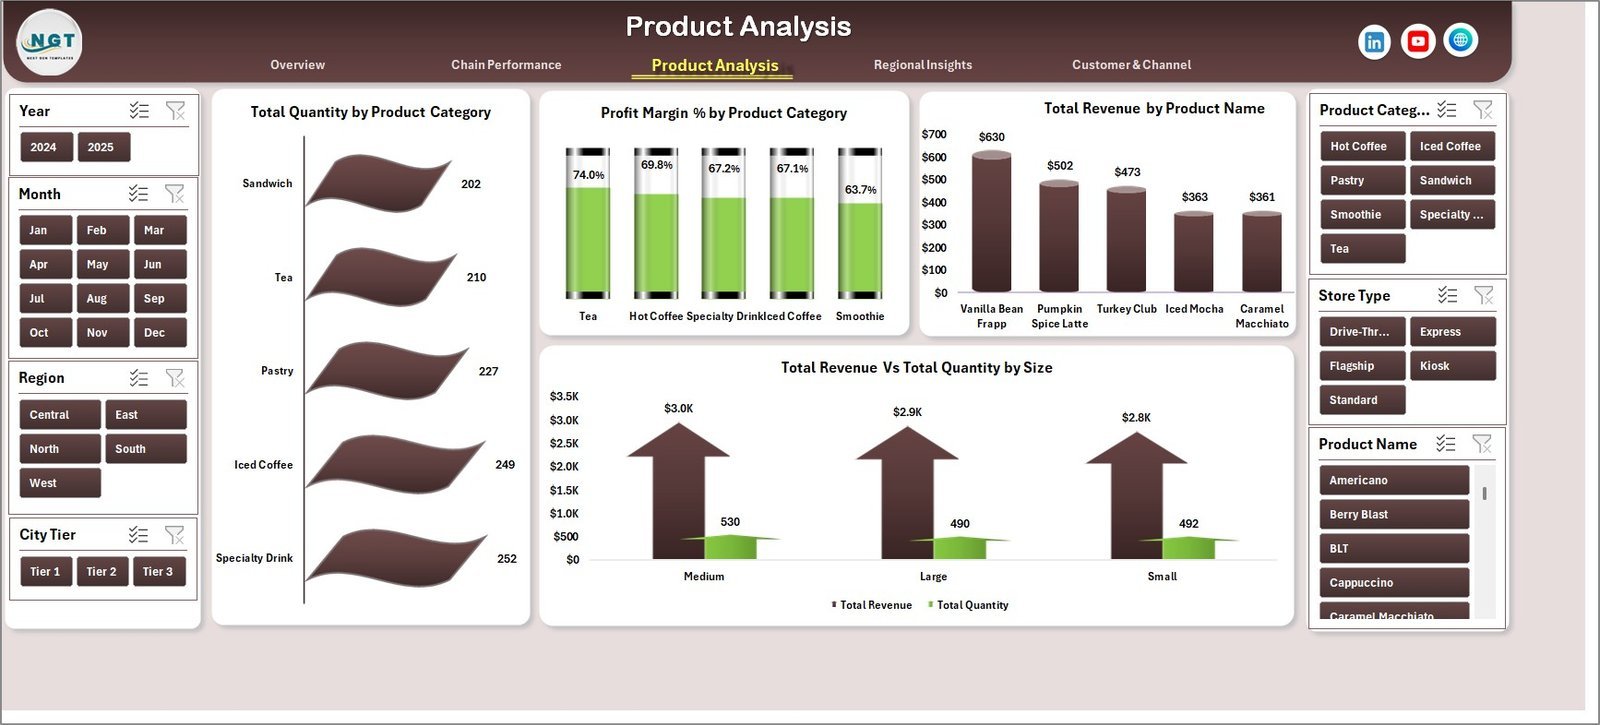
📊 Product Analysis Page – Covers Total Quantity by Product Category, Profit Margin % by Product Category, Total Revenue by Product Name, and Total Revenue Vs Total Quantity by Size.
 Regional Insights
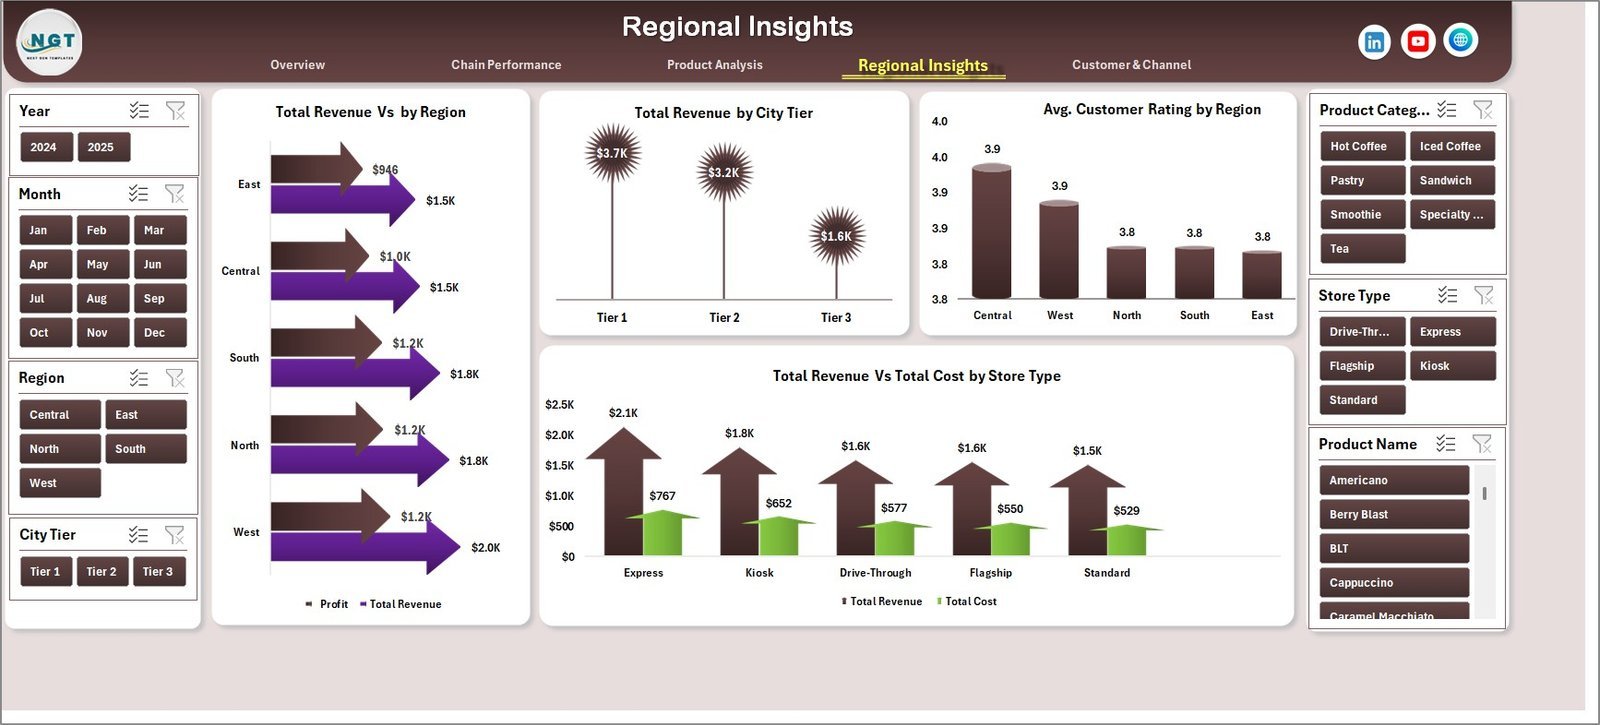
📊 Regional Insights Page – Visualizes Total Revenue Vs by Region, Total Revenue by City Tier, Avg. Customer Rating by Region, and Total Revenue Vs Total Cost by Store Type.
 Customer & Channel
📊 Customer & Channel Page – Analyzes Total Revenue Vs Total Records by Order Channel, Total Revenue by Customer Type, and Total Revenue Vs by Loyalty Member.
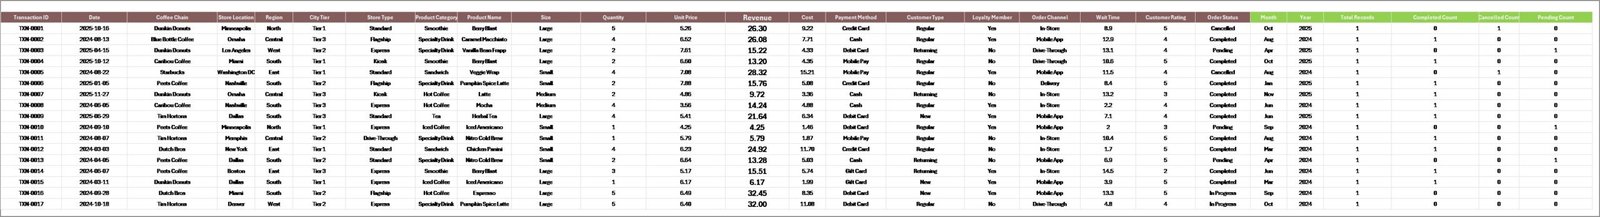 Data Sheet
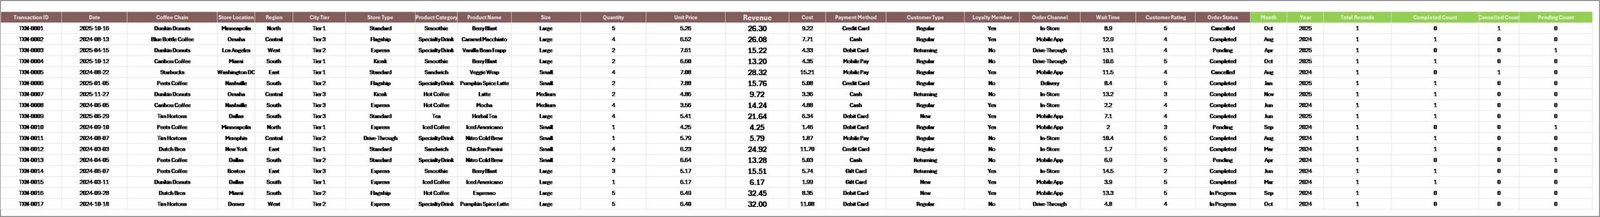
📊 Data Sheet – This is your data entry point. Add your coffee chain transaction records in the same format, and the entire dashboard auto-updates upon refresh.
 Support Sheet
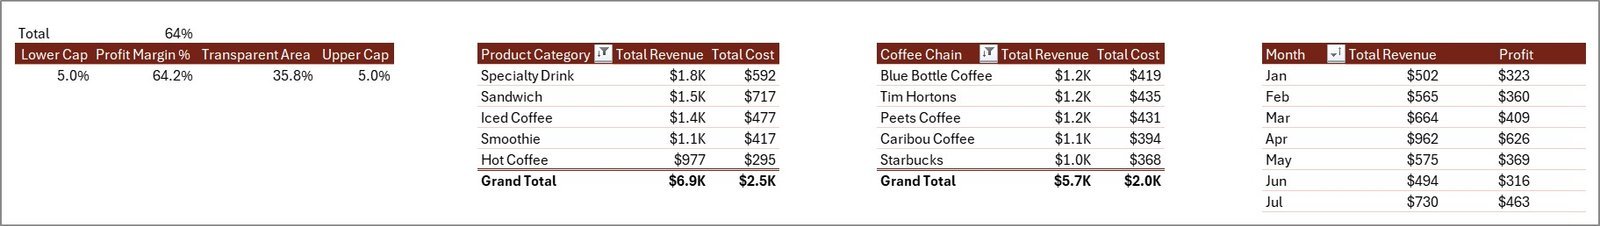
📊 Support Sheet – Contains all pivot tables that power the dashboard charts. After updating data, go to the Data tab in the Excel Ribbon and click Refresh All. All pivots and charts update instantly. You can keep this sheet hidden during regular use.
⚙️ How to Use the Coffee Chains Dashboard in Excel
1️⃣ Download and Open – Download the ZIP file, extract it, and open the Excel file in Microsoft Excel (2016 or later recommended).
2️⃣ Go to the Data Sheet – Navigate to the Data Sheet tab and replace the sample data with your own coffee chain records in the same column format.
3️⃣ Refresh the Dashboard – Click on the Data tab in the Excel Ribbon and select Refresh All. All pivot tables and charts will update automatically.
4️⃣ Use Slicers for Filtering – On the Overview page, use the built-in slicers to filter data by specific dimensions and see instant results.
5️⃣ Explore All 5 Pages – Navigate through the Overview, Chain Performance, Product Analysis, Regional Insights, and Customer & Channel tabs for complete analytics.
👥 Who Can Benefit from This Coffee Chains Dashboard
☕ Coffee Chain Owners & Franchise Managers – Monitor performance across multiple outlets and identify growth opportunities.
☕ Business Analysts & Data Analysts – Quickly analyze coffee sales data with pre-built charts and pivot tables.
☕ Operations Managers – Track order completion rates, revenue per order, and regional performance effortlessly.
☕ Marketing Teams – Understand customer segments, loyalty patterns, and channel-wise revenue to optimize campaigns.
☕ Finance Teams – Monitor profit margins, cost breakdowns, and revenue trends for strategic planning.
☕ Retail & F&B Consultants – Use this as a client-ready reporting tool for coffee business consulting engagements.
Looking for franchise-level analytics? Explore our Franchise Performance KPI Dashboard in Excel as well.
❓ Frequently Asked Questions
What KPIs does the Coffee Chains Dashboard in Excel track?
The Coffee Chains Dashboard in Excel tracks 5 key metrics on its Overview page: Total Revenue, Net Profit, Total Records, Customer Rating, and Total Quantity. Additional analysis includes Profit Margin %, Order Completion %, and Average Revenue Per Order across multiple dashboard pages.
Do I need advanced Excel skills to use this dashboard?
No. This dashboard requires no advanced Excel skills. Simply replace the sample data in the Data Sheet with your own records and click Refresh All in the Data tab. All charts and KPIs update automatically through pivot tables.
Can I compare multiple coffee chains in this dashboard?
Yes. The Chain Performance page is specifically designed to compare Net Profit, Customer Ratings, Order Completion %, and Average Revenue Per Order across different coffee chains side by side.
Does this template work without VBA or macros?
Yes. The Coffee Chains Dashboard in Excel is 100% formula and pivot-table based. No VBA or macros are required. It works in Microsoft Excel 2016 and later versions without needing to enable macros.
What kind of data do I need to use this dashboard?
You need coffee chain transaction data including fields like Coffee Chain name, Product Category, Product Name, Revenue, Cost, Quantity, Region, City Tier, Store Type, Customer Type, Order Channel, Loyalty Member status, and Customer Rating. A sample dataset is pre-loaded for reference.
Can I customize or add more charts to this dashboard?
Absolutely. Since the dashboard is built on pivot tables, you can add new pivot charts, modify existing ones, or add additional slicers based on your specific reporting needs.
🔗 Explore Related Templates
🔹 Food and Beverage Dashboard in Excel – Comprehensive analytics for the entire food and beverage industry.
🔹 Food Service KPI Dashboard in Excel – Track KPIs specific to food service operations.
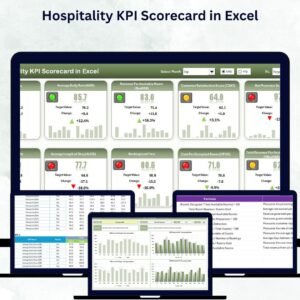
🔹 Hospitality KPI Scorecard in Excel – Ideal for hospitality and hotel management professionals.
📖 Click here to read the Detailed Blog Post
🎥 Visit our YouTube channel to learn step-by-step video tutorials
👉 YouTube.com/@NextGenTemplates


Reviews
There are no reviews yet.