In today’s fast-moving healthcare environment, cardiology institutes must monitor performance with precision and speed. Hospitals deal with critical heart-related cases daily. Therefore, decision-makers need real-time insights to improve patient outcomes and operational efficiency. However, many organizations still rely on manual reporting and scattered systems. As a result, delays happen, and performance visibility becomes limited.
To overcome this challenge, healthcare organizations are shifting toward data-driven solutions. The Cardiology Institutes KPI Dashboard in Power BI is a powerful, ready-to-use analytics tool designed to transform how cardiology departments track and analyze performance.
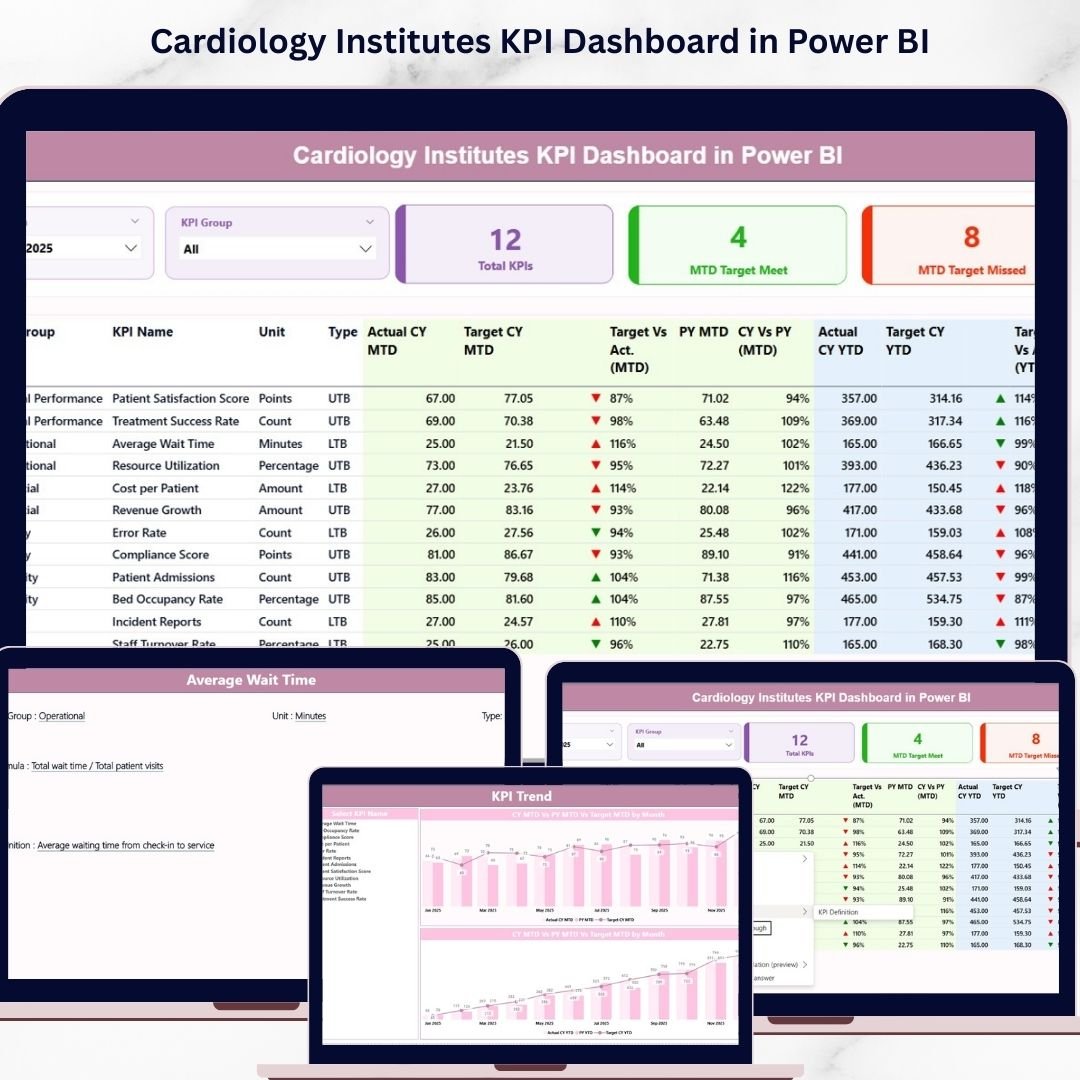
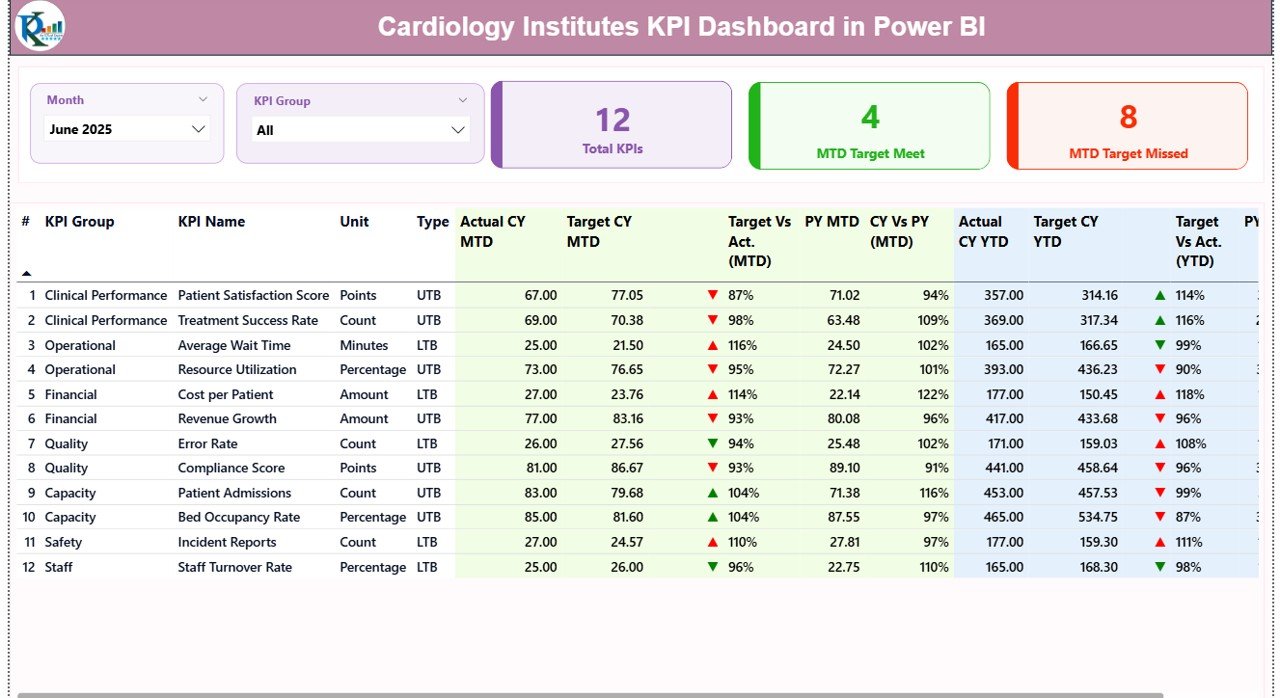
With this dashboard, you can monitor KPIs, compare actual vs target values, and make faster, smarter decisions—all in one centralized platform.
🚀 Key Features of Cardiology Institutes KPI Dashboard in Power BI
✨ Interactive Summary Dashboard – Get a complete overview of KPIs with dynamic slicers for Month and KPI Group.
📊 KPI Cards for Quick Insights – Instantly view Total KPIs, MTD Target Achieved, and MTD Target Missed.
📈 MTD & YTD Performance Tracking – Monitor Month-to-Date and Year-to-Date metrics with accuracy.
🎯 Target vs Actual Comparison – Identify performance gaps quickly using visual indicators.
🔺 Conditional Formatting Indicators – Green and red arrows show performance status instantly.
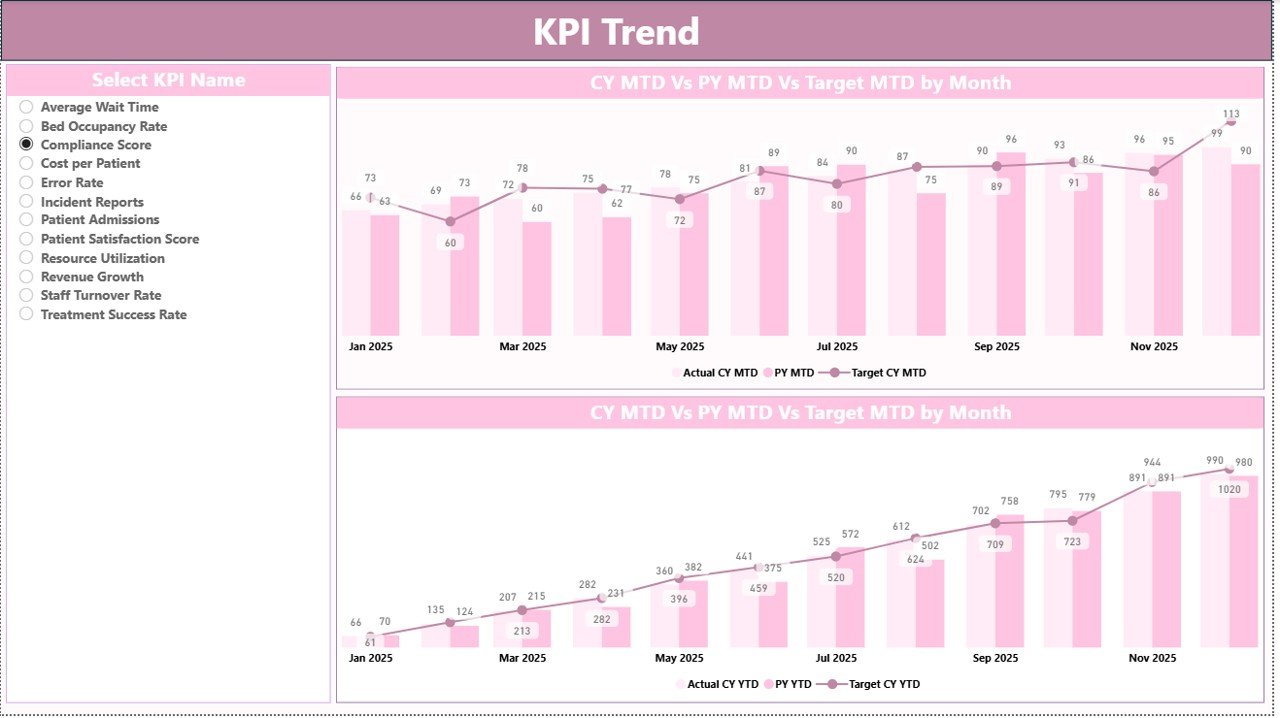
📉 KPI Trend Analysis Page – Analyze trends with combo charts comparing Actual, Target, and Previous Year.
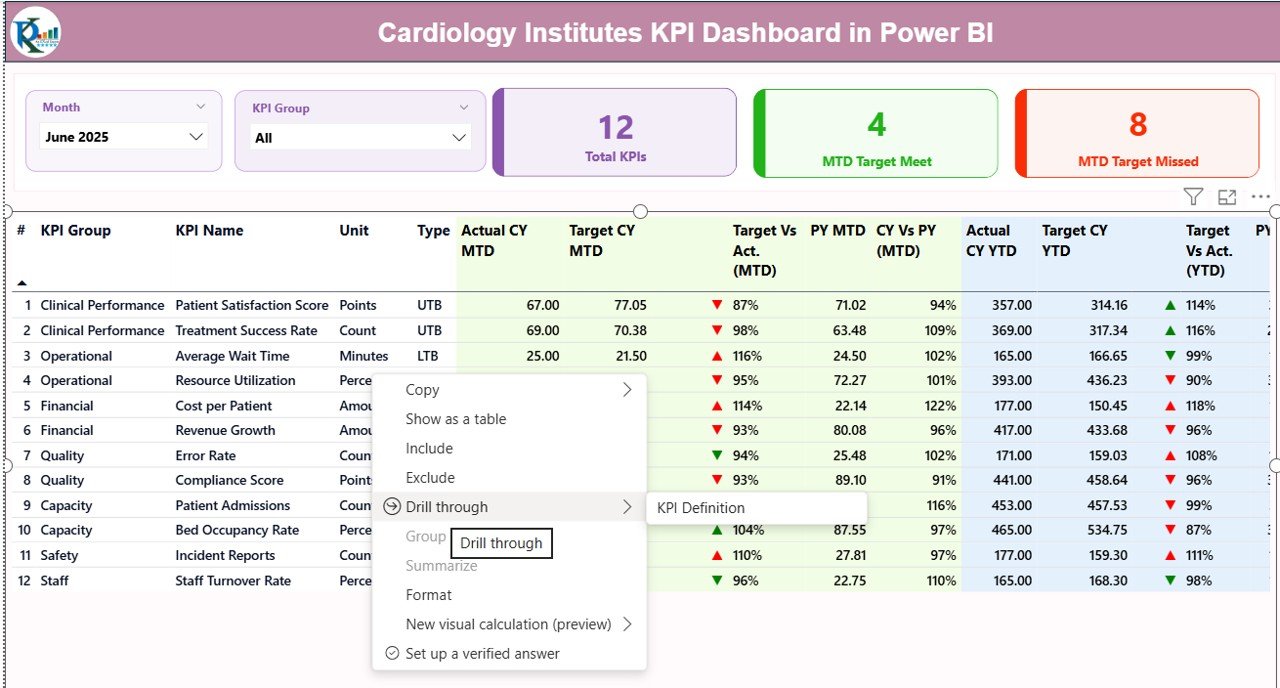
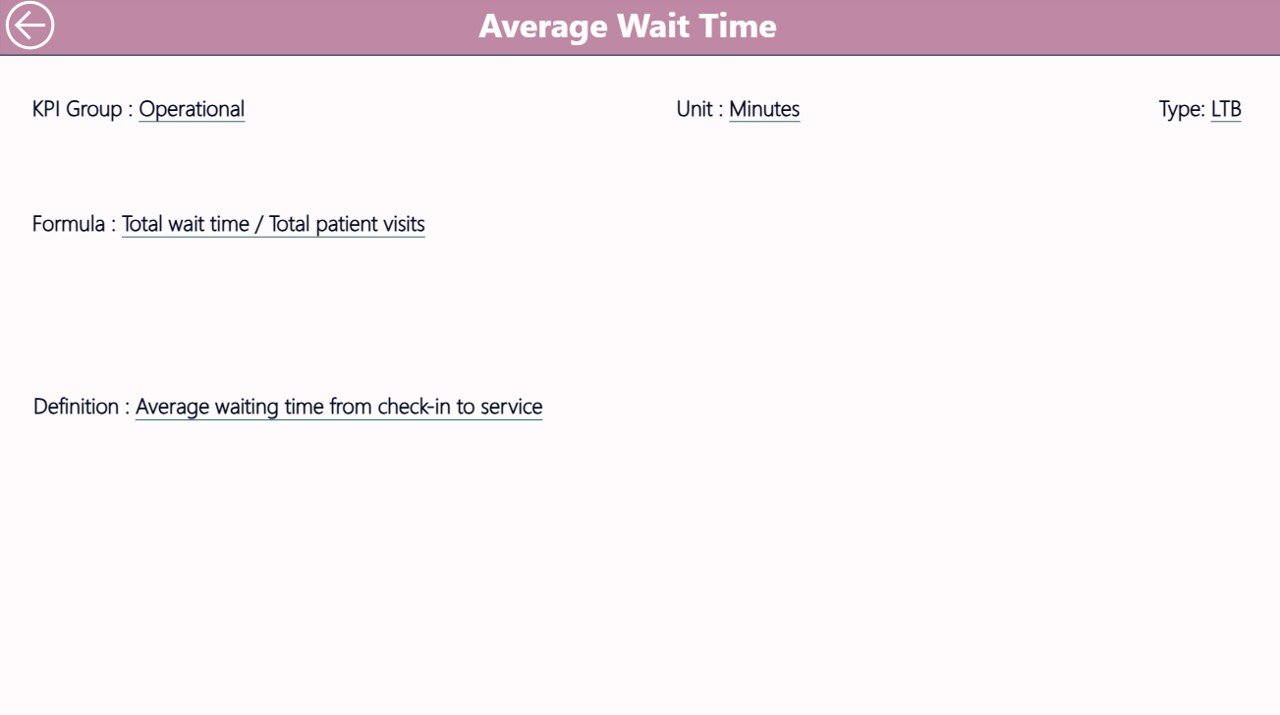
📘 KPI Definition Drill-Through Page – Understand KPI formulas, logic, and definitions clearly.
🔄 Dynamic Filters & Slicers – Customize dashboard views effortlessly.
📂 Excel-Based Data Source – Easily update data using structured Excel sheets.
⚡ User-Friendly Interface – Designed for quick adoption without advanced Power BI skills.
📦 What’s Inside the Cardiology Institutes KPI Dashboard in Power BI
This professional dashboard comes with a well-structured Power BI file and Excel data model.
📊 3 Interactive Dashboard Pages
-
Summary Page for KPI overview
-
KPI Trend Page for performance visualization
-
KPI Definition Page for detailed insights
📁 Excel Data Input Files
-
Input_Actual Sheet for MTD & YTD values
-
Input_Target Sheet for performance targets
-
KPI Definition Sheet for KPI metadata
📌 Pre-Built KPI Structure
Includes KPI Number, KPI Group, KPI Name, Unit, Type (LTB/UTB), and formulas
📉 Advanced Visualizations
Combo charts, KPI cards, slicers, and drill-through navigation
⚙️ How to Use the Cardiology Institutes KPI Dashboard in Power BI
Using this dashboard is simple and efficient.
📝 Step 1: Enter Data in Excel
Update Actual, Target, and KPI Definition sheets regularly
📊 Step 2: Refresh Power BI Dashboard
Load updated data with a single refresh
🎯 Step 3: Apply Filters
Select Month and KPI Group using slicers
📈 Step 4: Analyze Performance
Review KPI cards, tables, and trend charts
🔍 Step 5: Drill Through for Details
Click any KPI to view its definition and formula
Because of this structured workflow, you can quickly turn raw data into actionable insights.
👨⚕️ Who Can Benefit from This Cardiology Institutes KPI Dashboard in Power BI
This dashboard is ideal for a wide range of healthcare professionals.
🏥 Hospital Administrators – Monitor overall performance and efficiency
👨⚕️ Cardiology Department Heads – Track clinical KPIs and treatment outcomes
📊 Healthcare Analysts – Analyze trends and generate insights
🧑💼 Operations Managers – Improve resource allocation and workflow
🩺 Medical Directors – Make data-driven strategic decisions
Even small clinics can use this dashboard to improve performance tracking and reporting.
This dashboard not only simplifies complex healthcare data but also empowers your team to make faster, smarter decisions. As a result, you can improve patient care, reduce delays, and enhance operational efficiency.
If you want to eliminate manual reporting, gain real-time insights, and take control of your cardiology performance metrics, this dashboard is the perfect solution for you.
Click here to read the Detailed blog post
Watch the step-by-step video tutorial:


