Managing modern buildings has become more complex than ever. Smart technologies such as HVAC automation, lighting systems, energy monitoring tools, and security systems generate massive amounts of operational data every day. Without a structured analytics system, it becomes extremely difficult for facility managers to monitor performance, track targets, and identify operational issues quickly.
This is exactly why the Building Automation KPI Dashboard in Power BI is designed.
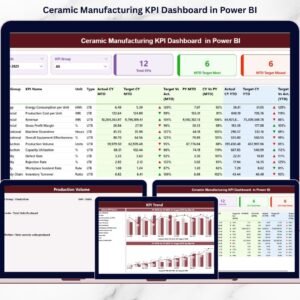
The Building Automation KPI Dashboard in Power BI is a powerful, ready-to-use analytics solution that converts raw building automation data into clear and interactive insights. Instead of working with multiple spreadsheets and reports, organizations can monitor all important KPIs in one centralized dashboard.
Built using Power BI’s advanced visualization capabilities, this dashboard helps organizations analyze system performance, monitor targets, track trends, and make better operational decisions.
Whether you manage a smart building, commercial complex, industrial facility, or energy-efficient infrastructure, this dashboard helps you monitor building performance in a clear and structured way.
Key Feature of Building Automation KPI Dashboard in Power BI
📊 Interactive KPI Monitoring
Track all building automation KPIs in a single Power BI dashboard with interactive filters and slicers.
📅 Month and KPI Group Slicers
Easily filter performance data by selecting a specific month or KPI group.
📈 MTD and YTD Performance Analysis
Monitor both Month-to-Date (MTD) and Year-to-Date (YTD) performance metrics for accurate tracking.
📉 Target vs Actual Comparison
Instantly compare actual KPI performance with defined targets.
🟢 Visual Performance Indicators
Green and red arrow indicators instantly show whether KPIs meet or miss targets.
📊 Trend Analysis Charts
Analyze historical KPI trends using interactive combo charts showing Actual, Target, and Previous Year values.
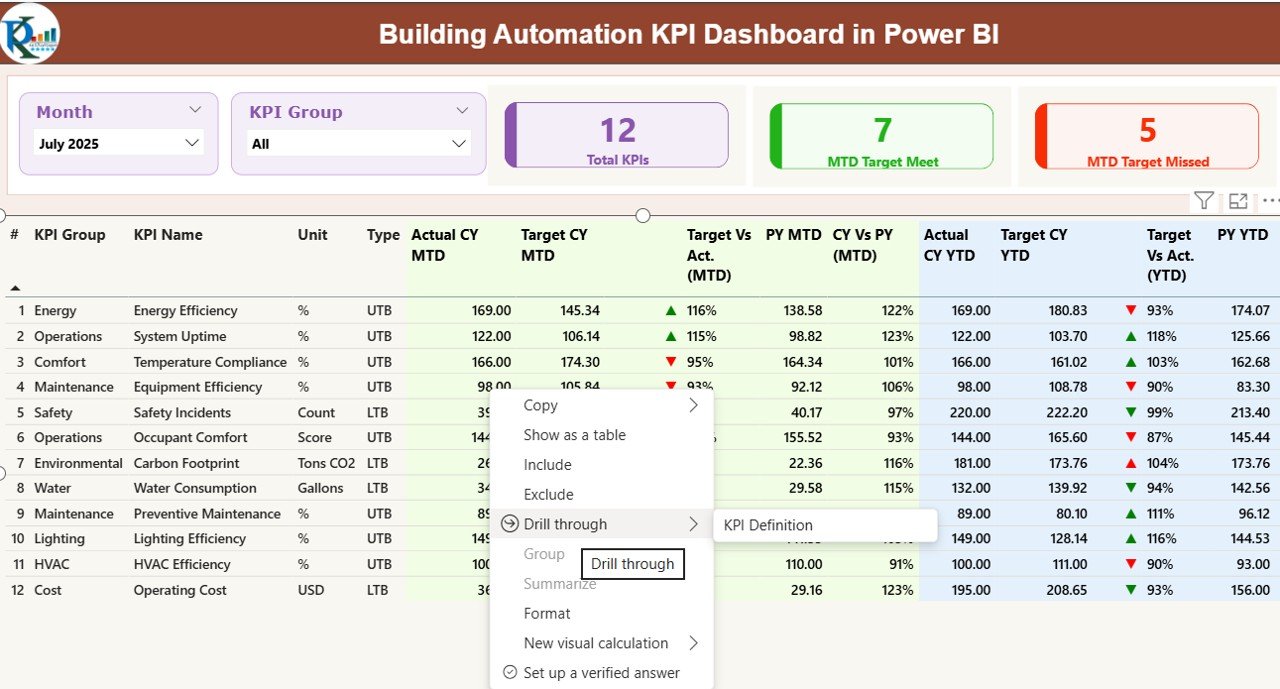
🔎 Drill-Through KPI Definition Page
Understand KPI formulas, definitions, measurement units, and KPI categories.
📁 Excel Data Integration
The dashboard connects directly to Excel data sources, making data entry simple and flexible.
⚡ Real-Time Performance Insights
When Excel data updates, the Power BI dashboard refreshes automatically.
What’s Inside the Building Automation KPI Dashboard in Power BI
This product includes a professionally designed Power BI dashboard with three powerful analytical pages.
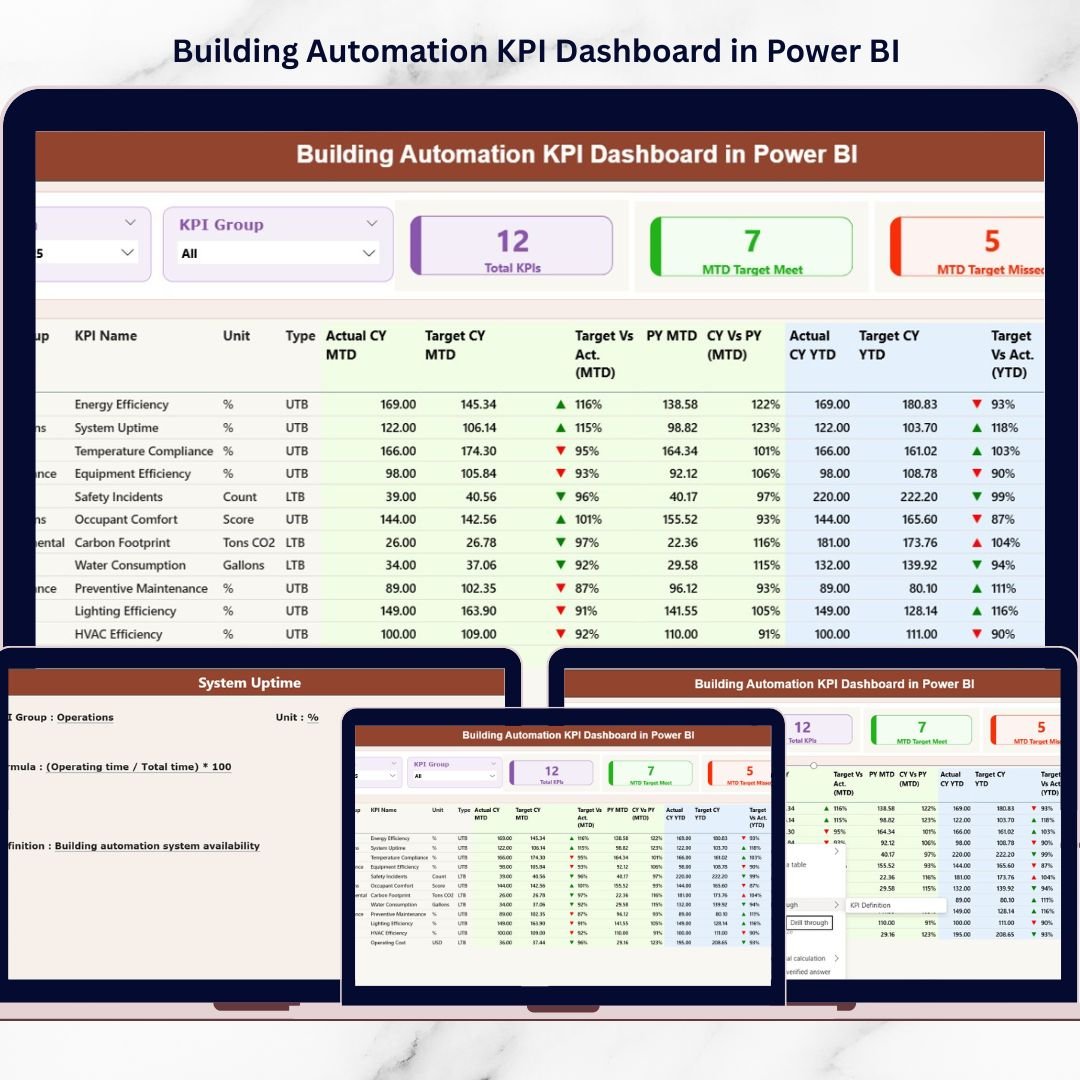
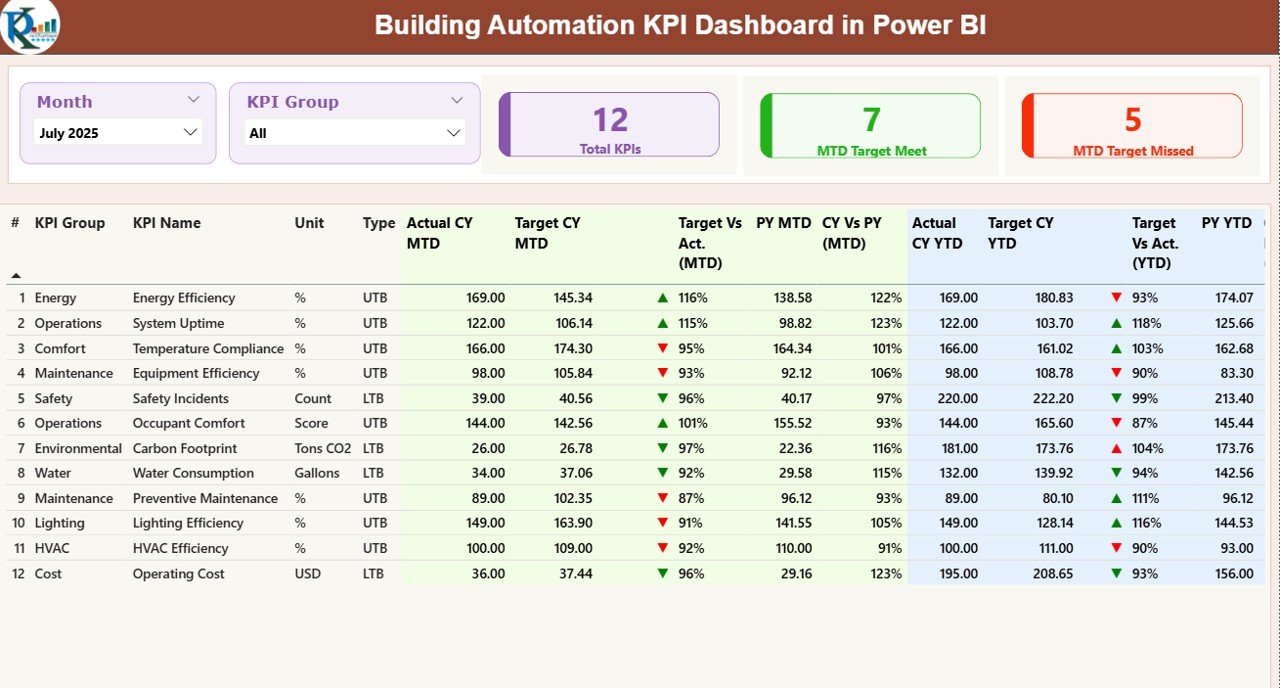
📊 1. Summary Page – Main Dashboard Overview
This page provides a complete overview of all building automation KPIs.
It includes:
• Total KPIs Count
• MTD Target Meet Count
• MTD Target Missed Count
The dashboard also contains a detailed KPI performance table showing:
• KPI Number
• KPI Group
• KPI Name
• Unit of Measurement
• KPI Type (LTB / UTB)
• Actual CY MTD
• Target CY MTD
• Target vs Actual (MTD)
• Previous Year MTD
• CY vs PY Comparison
• YTD Actual and Target Metrics
These insights allow managers to evaluate building system performance quickly.
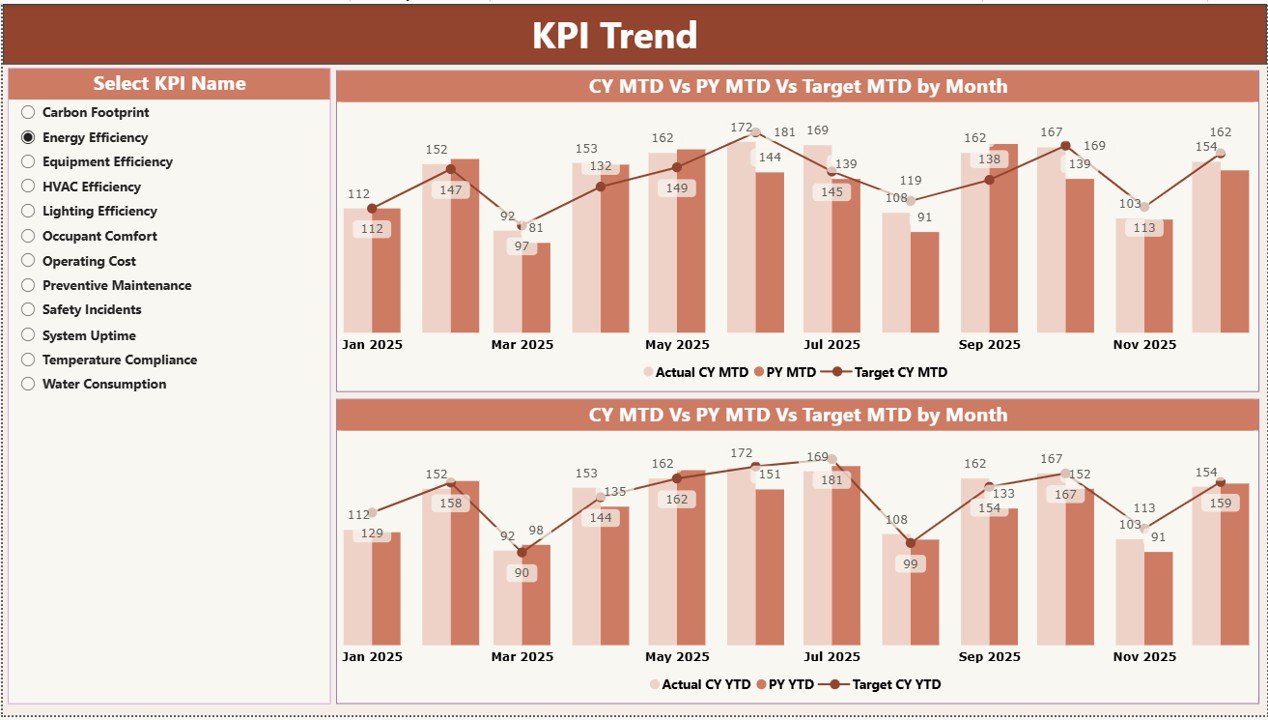
📈 2. KPI Trend Page – Performance Trend Analysis
This page helps users analyze how KPIs perform over time.
It includes interactive combo charts displaying:
• Current Year Values
• Previous Year Values
• Target Values
Users can also select a specific KPI using the KPI Name slicer to analyze its historical performance.
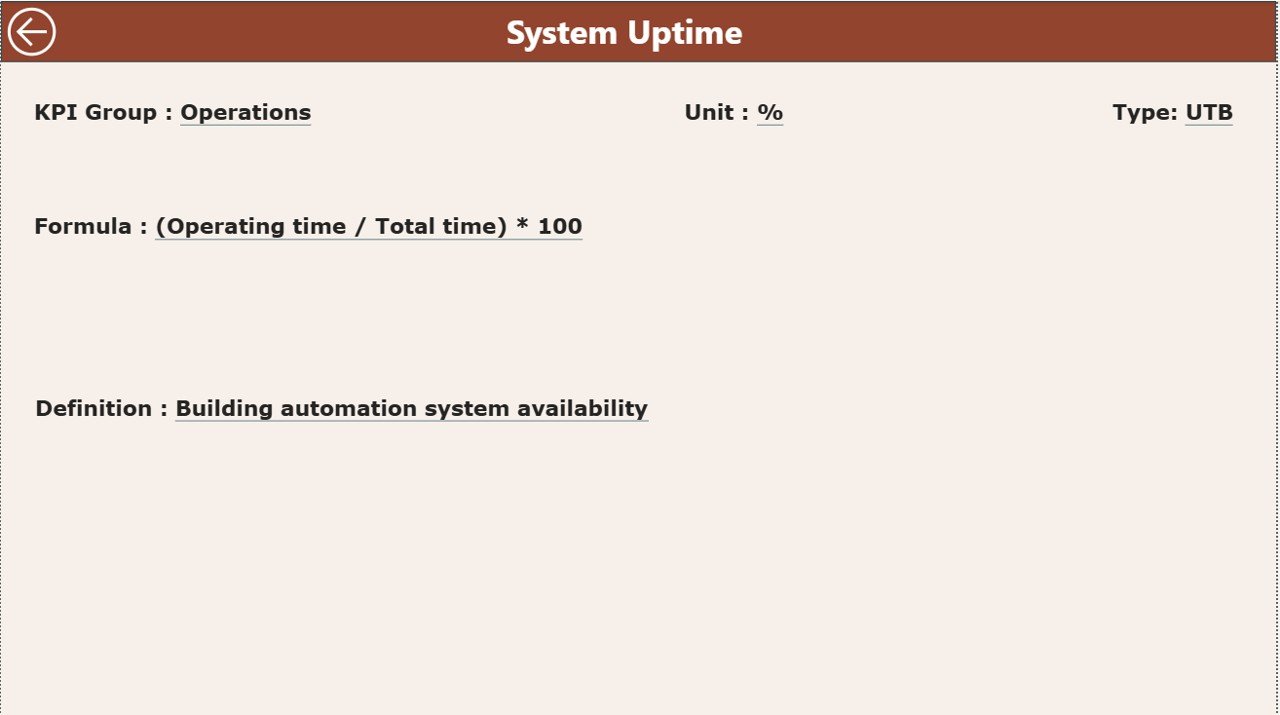
📘 3. KPI Definition Page – Detailed KPI Documentation
This page provides detailed KPI information including:
• KPI Number
• KPI Name
• KPI Formula
• KPI Definition
• KPI Group
• Measurement Unit
• KPI Type (LTB or UTB)
This helps users clearly understand how KPIs are calculated.
How to Use the Building Automation KPI Dashboard in Power BI
Using this dashboard is simple and efficient.
1️⃣ Enter KPI data in the provided Excel input sheets.
2️⃣ Load the Excel file into Power BI.
3️⃣ Refresh the dashboard to update the reports.
4️⃣ Use slicers and filters to analyze performance.
The Excel file includes the following worksheets:
📄 Input_Actual Sheet
Stores actual KPI performance data including MTD and YTD values.
📄 Input_Target Sheet
Stores target KPI values for comparison.
📄 KPI Definition Sheet
Contains KPI formulas, descriptions, units, and KPI types.
Because of this structured setup, organizations can easily maintain accurate data and generate powerful insights.
Who Can Benefit from This Building Automation KPI Dashboard
This dashboard is designed for professionals managing modern facilities and smart building environments.
👨💼 Facility Managers
Monitor energy efficiency and system performance.
🔧 Maintenance Teams
Track equipment performance and downtime.
🏢 Building Operations Managers
Analyze operational efficiency and system reliability.
📊 Data Analysts
Evaluate performance trends and KPI insights.
⚡ Energy Management Teams
Monitor energy consumption and efficiency metrics.
🏭 Smart Building Operators
Optimize automation systems and operational performance.
Organizations using this dashboard can significantly improve facility management, energy efficiency, and operational decision-making.
Click here to read the Detailed blog post
Watch the step-by-step video tutorial: