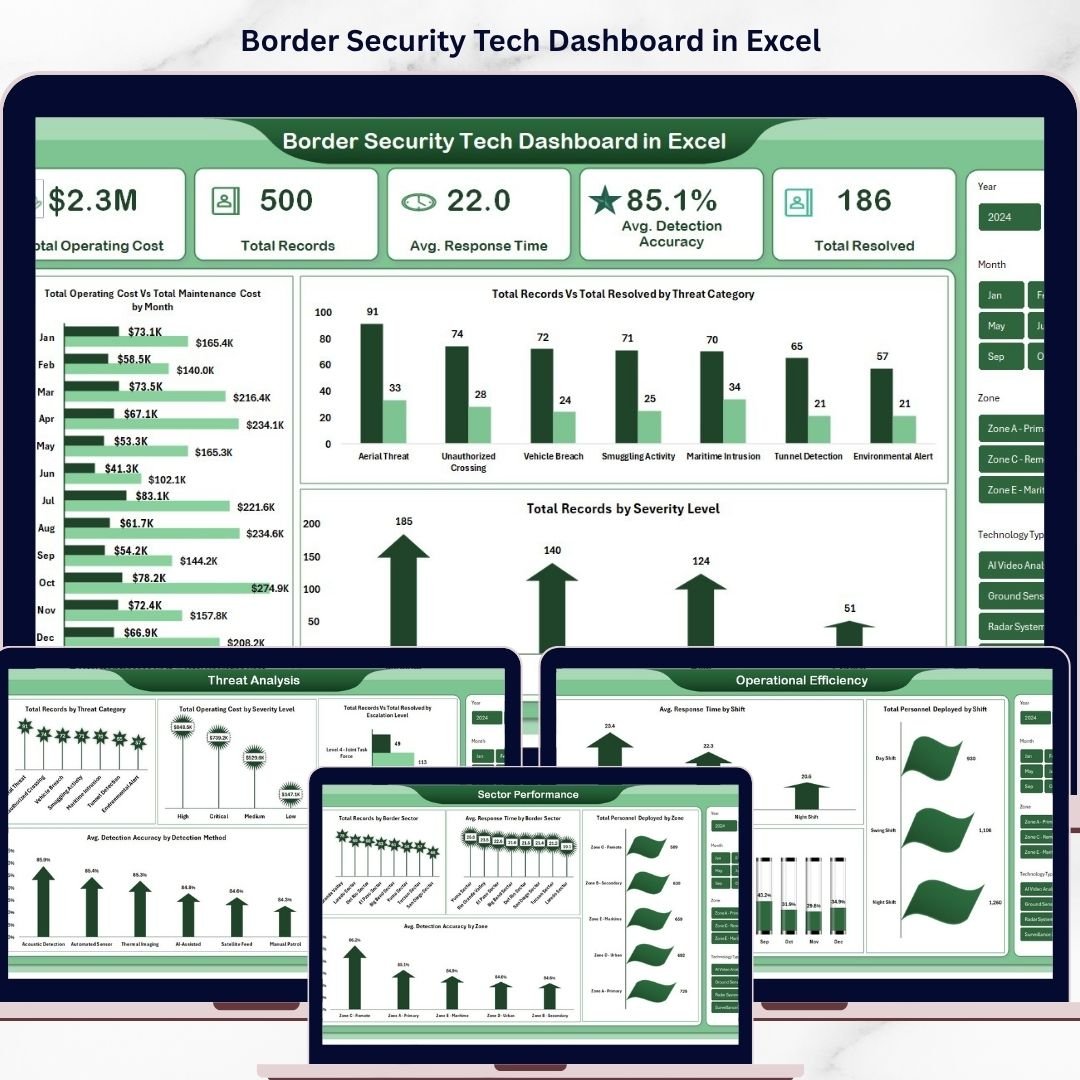
Border Security Tech Dashboard in Excel is a powerful, ready-to-use analytics template designed for border security agencies, homeland defense departments, government contractors, and security consultants who need to monitor surveillance technology performance, track threat detection accuracy, analyze sector operations, and evaluate operational efficiency across multiple border zones — all from one dynamic and interactive Excel Dashboard.
If you are managing border security operations and struggling to consolidate data from surveillance systems, detection technologies, patrol teams, and maintenance logs into one clear reporting view, this Border Security Tech Dashboard in Excel brings everything together into a professional, pivot-driven analytics hub. Simply enter your data in the Data sheet, refresh the pivots, and let the dashboard do the heavy lifting — giving you instant visibility into operating costs, threat categories, response times, detection accuracy, and resolution rates across every sector and zone.
🔑 Key Features of Border Security Tech Dashboard in Excel
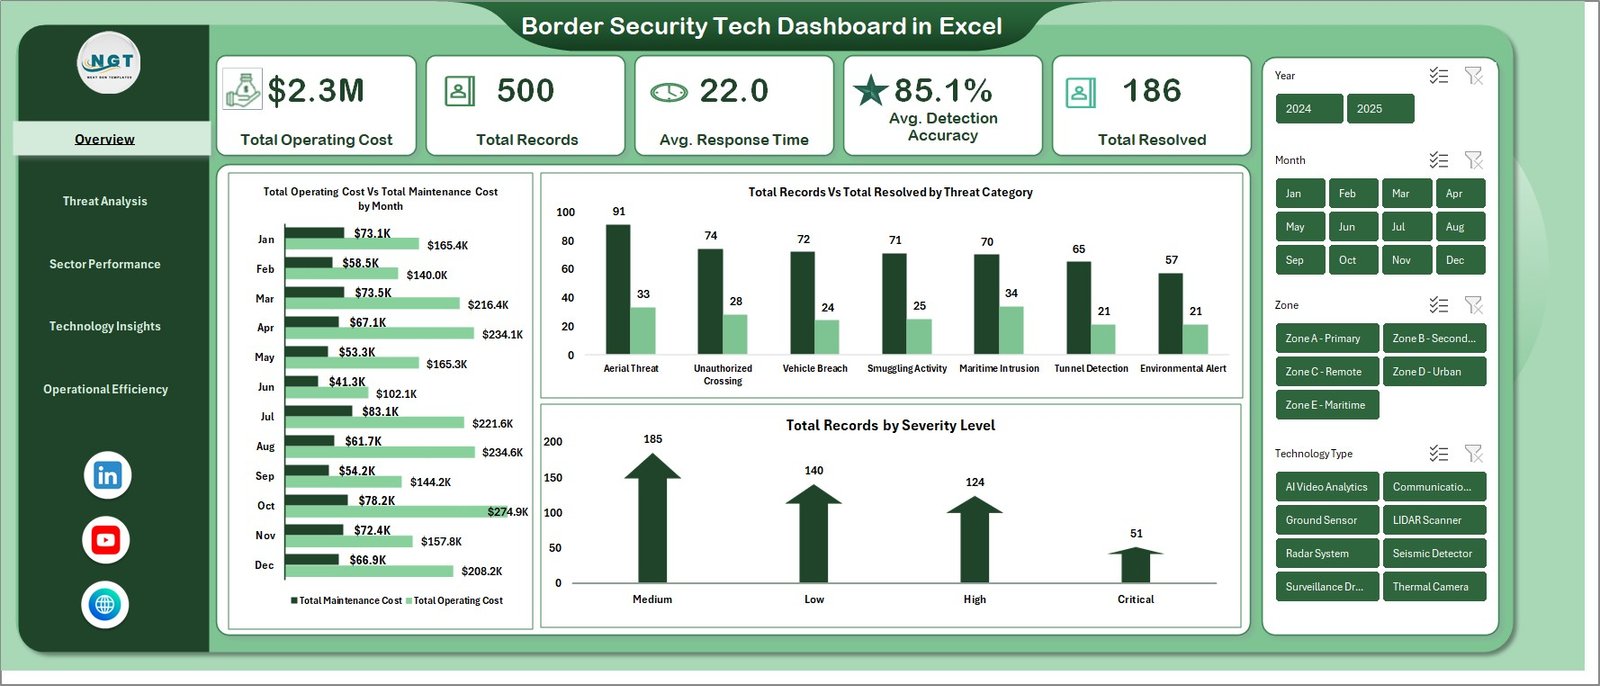
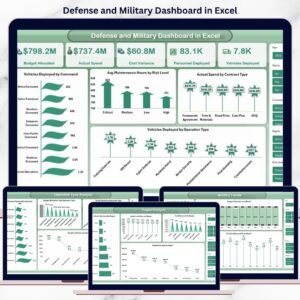
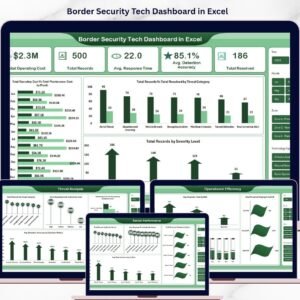
📊 Comprehensive KPI Cards — Monitor critical border security metrics at a glance including Total Operating Cost, Total Records, Avg. Response Time, Avg. Detection Accuracy, and Total Resolved from dynamic KPI cards on the overview page that give decision-makers an instant snapshot of operational health.
📈 Interactive Charts and Visualizations — Analyze border security operations through dynamic charts such as Total Operating Cost by Total Maintenance Cost, Total Records by Total Resolved by Threat Category, Total Records by Severity Level, and many more across five dedicated analysis pages.
🎯 Smart Slicers and Filters — Instantly filter your data by threat category, severity level, border sector, zone, technology type, shift, escalation level, and detection method to drill down into the exact operational insights you need for strategic decision-making.
📅 5 Dedicated Dashboard Pages — Explore Overview, Threat Analysis, Sector Performance, Technology Insights, and Operational Efficiency pages for a complete 360-degree view of your border security technology operations.
🔄 Fully Dynamic with Pivot Tables — Powered by pivot tables in the Support sheet so the entire dashboard updates automatically when you refresh the data. No complex formulas or VBA needed.
💾 Easy Data Entry — Simply add your operational data in the structured Data sheet and click Refresh All to update every chart, card, and analysis page instantly.

Border Security Tech Dashboard in Excel
📦 What’s Inside the Border Security Tech Dashboard in Excel
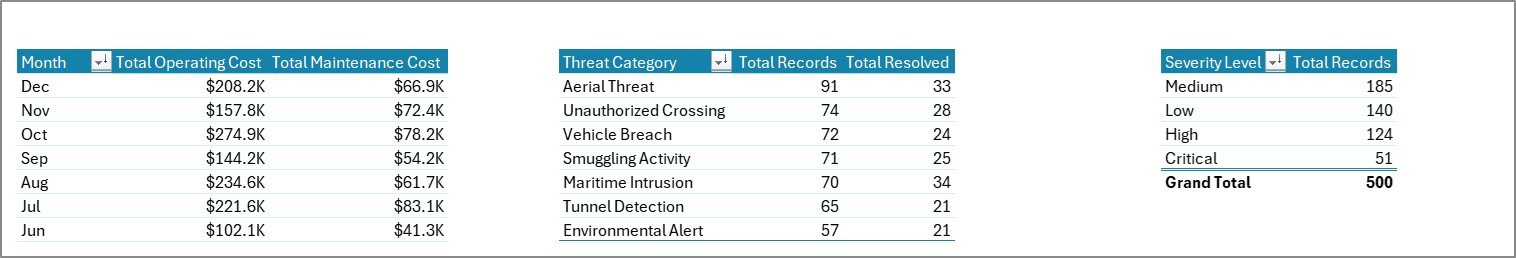
📌 Overview Page — High-level KPI cards displaying Total Operating Cost, Total Records, Avg. Response Time, Avg. Detection Accuracy, and Total Resolved. Interactive charts showing Total Operating Cost by Total Maintenance Cost, Total Records by Total Resolved by Threat Category, and Total Records by Severity Level. Multiple slicers are available to apply filters and see the filtered dashboard quickly.
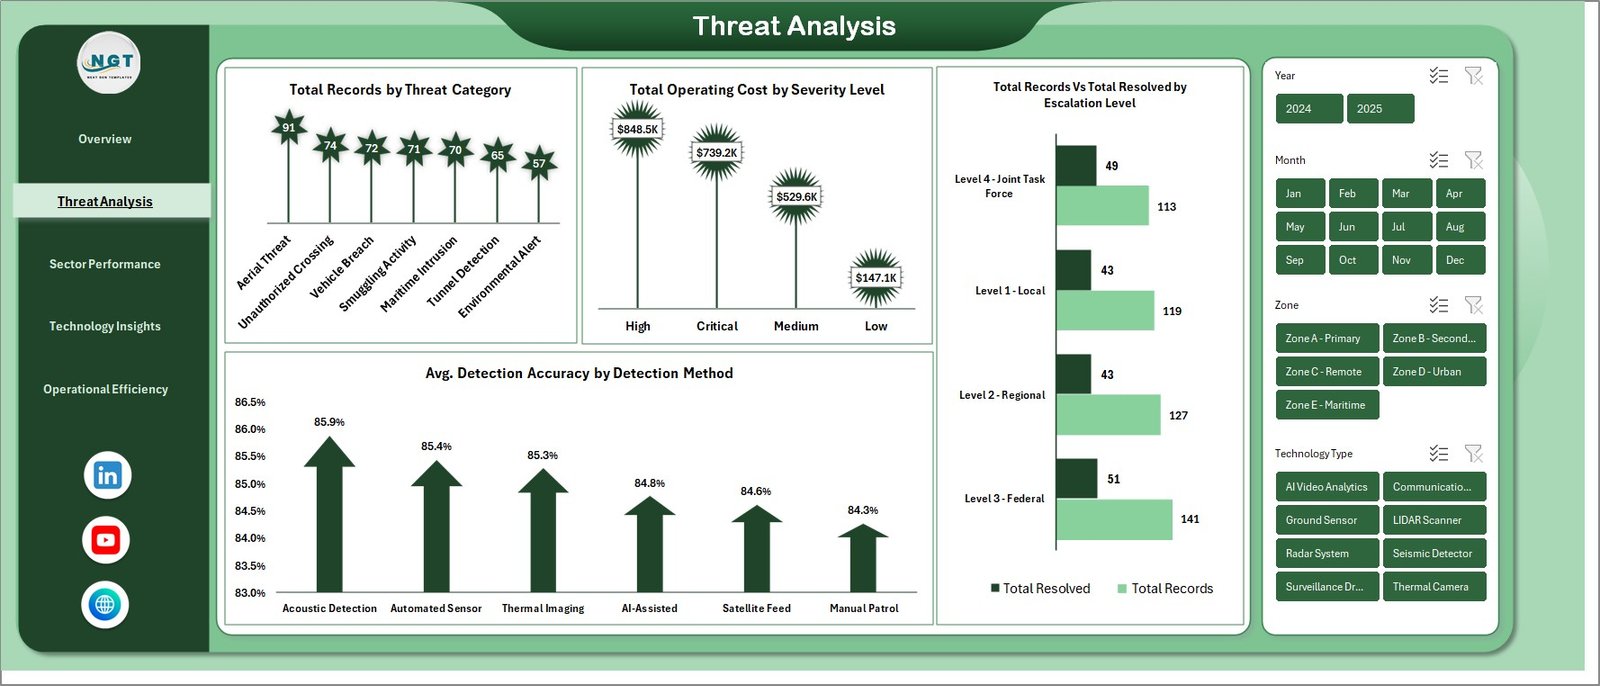
📌 Threat Analysis Page — Detailed breakdown of border threats including Total Records by Threat Category, Total Operating Cost by Severity Level, Total Records by Total Resolved by Escalation Level, and Avg. Detection Accuracy by Detection Method to identify which threats are most prevalent and how effectively they are being detected.
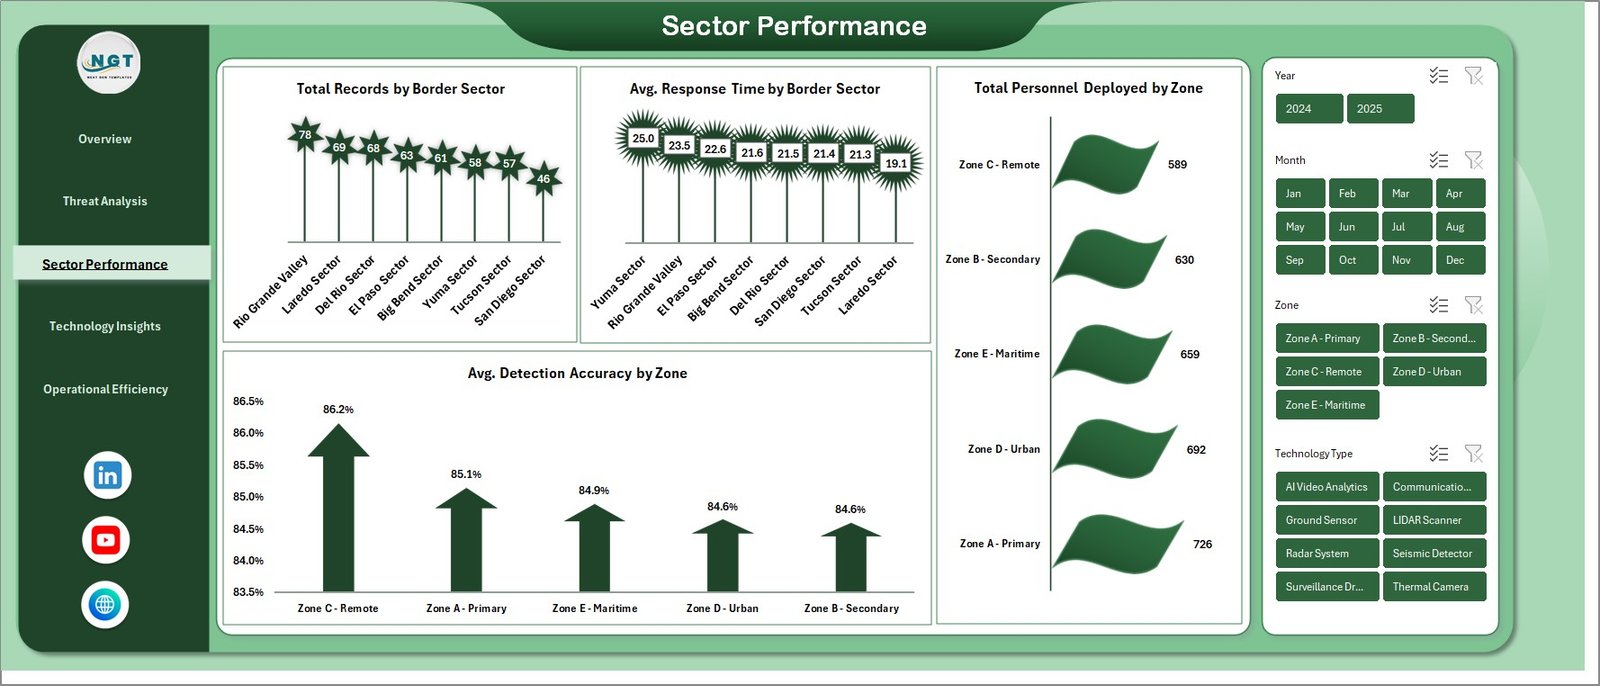
📌 Sector Performance Page — Comprehensive sector-level monitoring with Total Records by Border Sector, Avg. Response Time by Border Sector, Total Personnel Deployed by Zone, and Avg. Detection Accuracy by Zone to evaluate which sectors and zones are performing optimally.
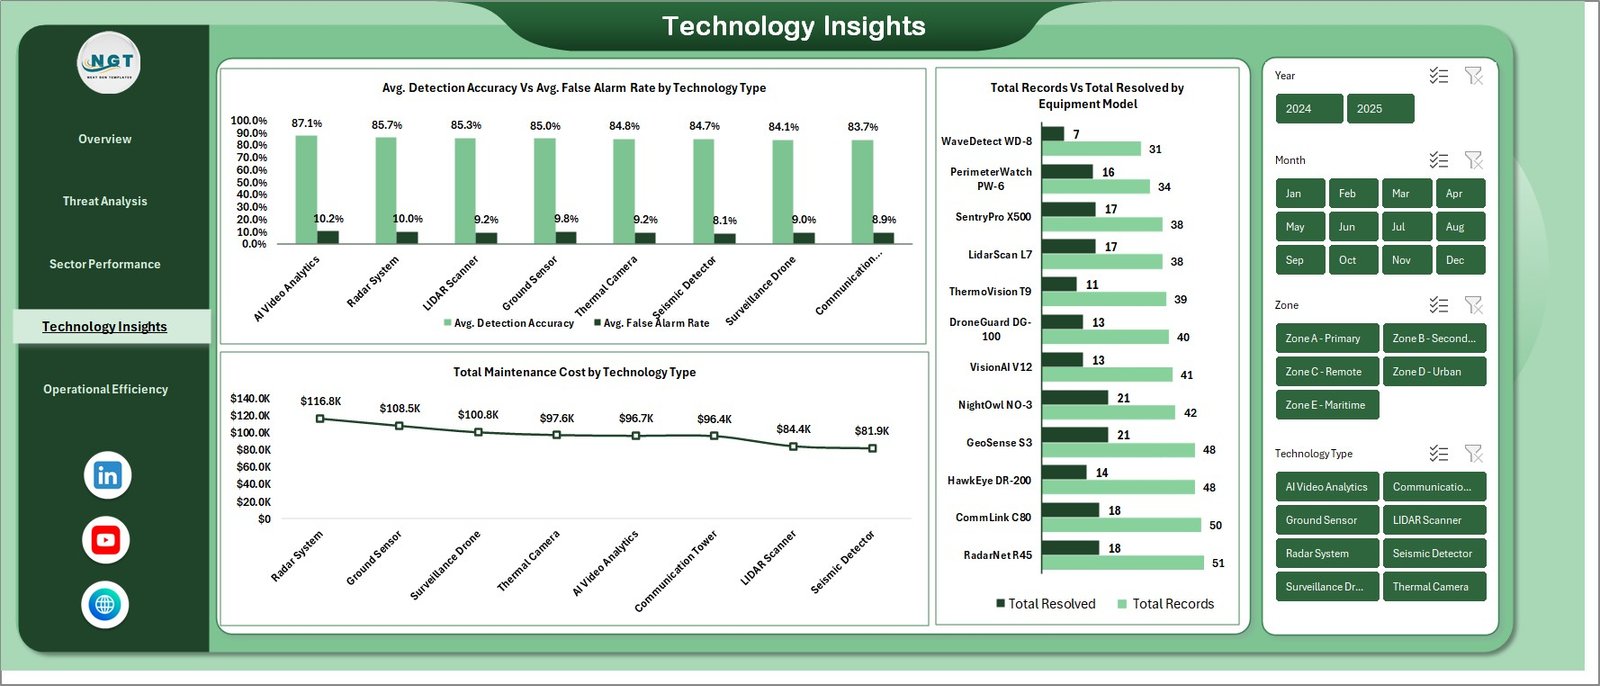
📌 Technology Insights Page — Technology-focused analysis covering Avg. Detection Accuracy Vs Avg. False Alarm Rate by Technology Type, Total Records by Total Resolved by Technology Type, and Total Maintenance Cost by Technology Type to help procurement and maintenance teams evaluate technology ROI.
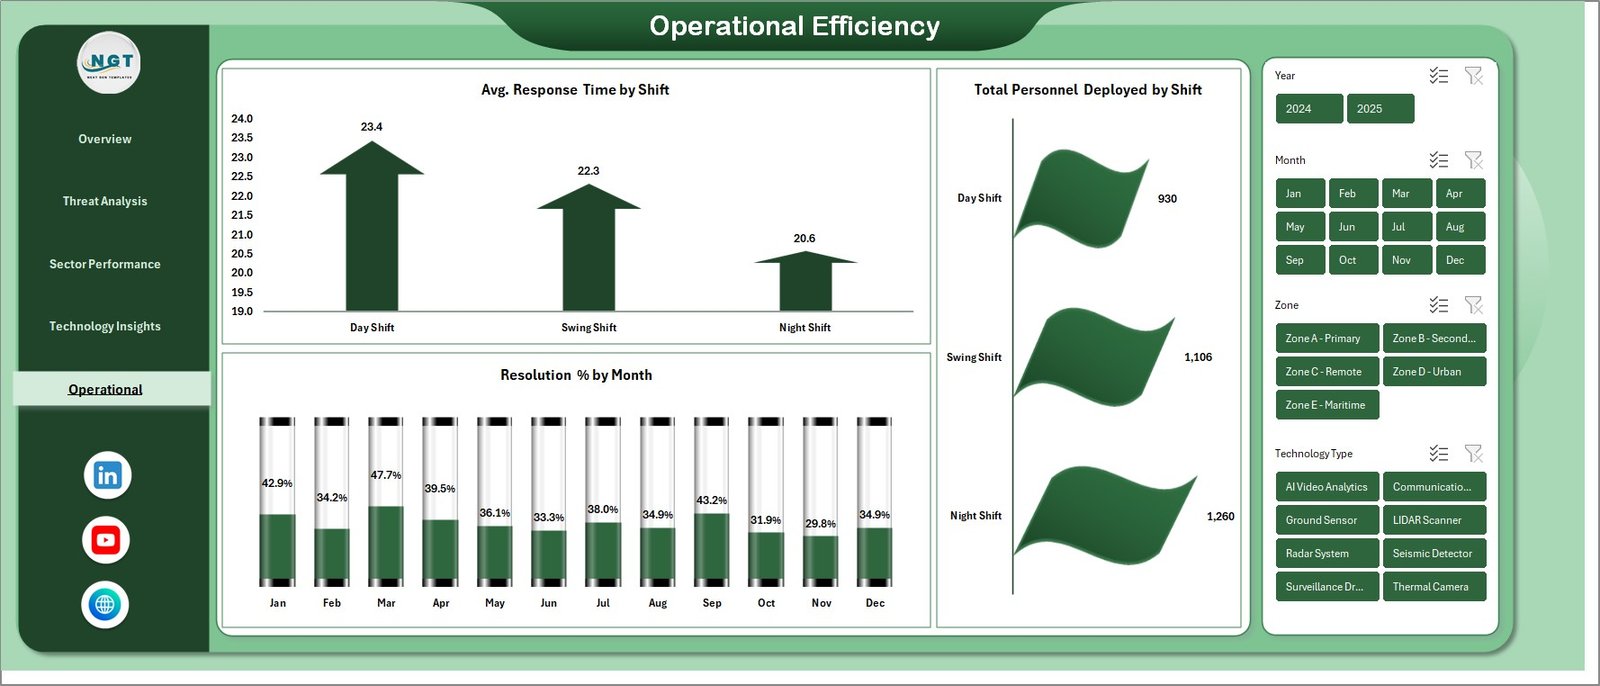
📌 Operational Efficiency Page — Workforce and efficiency tracking with Avg. Response Time by Shift, Total Personnel Deployed by Shift, and Resolution % by Month to optimize staffing schedules and measure monthly resolution performance trends.
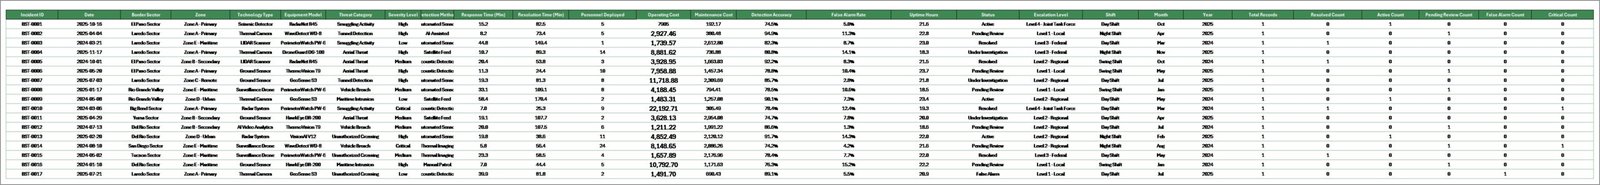
📌 Data Sheet — Structured data entry sheet where you input all border security operational data in a clean tabular format. Simply replace the sample data with your own records keeping the same column structure.
📌 Support Sheet — Contains all pivot tables that power the dashboard dynamically. Go to the Data tab in the Excel Ribbon and click Refresh All after updating the data in the Data sheet. All pivots will be refreshed and all charts will be refreshed. You can keep this sheet hidden.
⚙️ How to Use the Border Security Tech Dashboard in Excel
1️⃣ Download and Open — Download the Excel file and open it. Enable editing and macros if prompted.
2️⃣ Enter Your Data — Navigate to the Data sheet and replace the sample data with your actual border security operational records following the same column structure.
3️⃣ Refresh the Dashboard — Go to the Data tab in the Excel Ribbon and click Refresh All. All pivot tables in the Support sheet will update, and every chart and KPI card across all five dashboard pages will reflect your new data instantly.
4️⃣ Apply Filters — Use the slicers on each page to filter by threat category, severity level, border sector, zone, technology type, or shift to get targeted insights.
5️⃣ Analyze and Report — Navigate through the five dashboard pages to explore threat analysis, sector performance, technology insights, and operational efficiency for data-driven border security decisions.
👥 Who Can Benefit from This Border Security Tech Dashboard in Excel
🏛️ Border Security Agencies — Monitor threat detection accuracy, operating costs, and resolution rates across all border sectors from a centralized dashboard.
🛡️ Homeland Defense Departments — Track patrol operations, personnel deployment, and response times by sector and shift to optimize border protection strategies.
📋 Government Contractors — Report on technology performance, maintenance costs, and false alarm rates to government clients with professional visualizations.
🔍 Security Consultants — Analyze border security data for advisory engagements and provide evidence-based recommendations using interactive charts and KPI analysis.
📊 Defense Analysts — Consolidate multi-sector operational data into one reporting hub for strategic threat analysis and performance tracking.
🎓 Academic Researchers — Use the structured data format and visual analytics for research and education purposes in security studies and defense technology programs.
📖 Click here to read the Detailed Blog Post about Border Security Tech Dashboard in Excel
Watch the step-by-step video tutorial:


Reviews
There are no reviews yet.