Asset management companies operate in a highly competitive, data-driven, and regulated environment. Portfolio performance, operational efficiency, compliance, and investor confidence depend heavily on timely and accurate insights. However, when KPIs are tracked using scattered Excel files or manual reports, teams lose visibility, speed, and strategic focus.
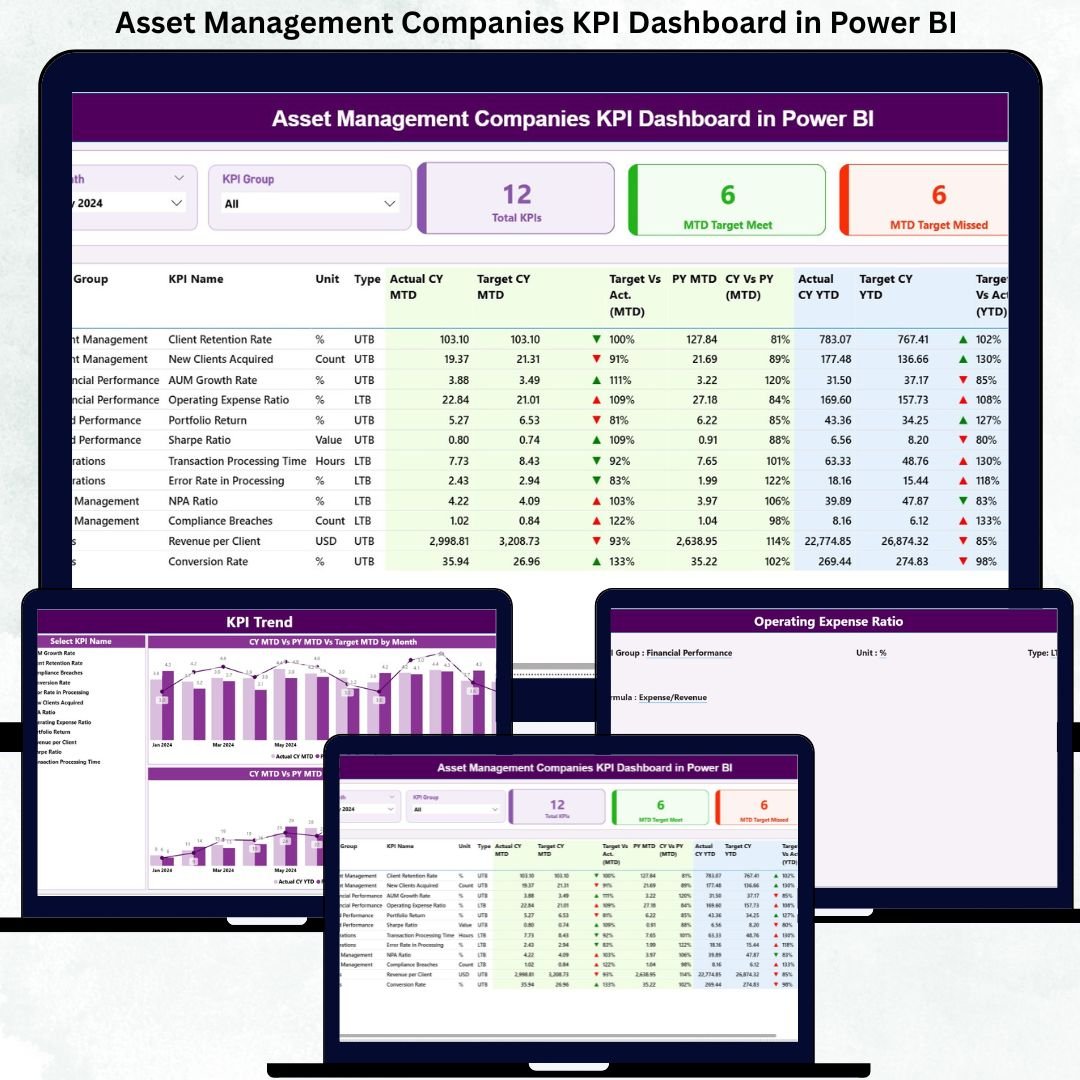
The Asset Management Companies KPI Dashboard in Power BI is built to eliminate these challenges. It provides a centralized, interactive, and visually powerful way to track operational, financial, and performance KPIs—all in one place. By combining Excel as a structured data source with Power BI’s advanced visualization and interactivity, this dashboard delivers clarity, accuracy, and confidence to decision-makers. 🚀
With automated MTD (Month-to-Date) and YTD (Year-to-Date) tracking, target vs actual comparisons, previous year benchmarking, and trend analysis, this dashboard becomes a strategic performance management tool for asset management firms of any size.
Key Features of the Asset Management Companies KPI Dashboard in Power BI ✨
This dashboard is designed specifically for asset management performance tracking:
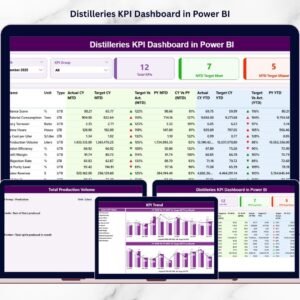
✨ 3 Powerful Analytical Pages – Summary, KPI Trend, and KPI Definition
📊 Automated KPI Summary Cards – Instantly view Total KPIs, Target Met & Target Missed
🎯 Interactive Slicers – Filter by Month and KPI Group with one click
📈 MTD & YTD Performance Tracking – Monitor short-term and long-term results
🔄 Target vs Actual Comparison – Identify gaps using clear percentage metrics
📉 CY vs PY Analysis – Compare current year performance with previous year
📘 Drill-Through KPI Definitions – Full transparency of formulas and KPI logic
🧮 Excel-Based Data Input – Simple, controlled, and scalable data updates
⚡ Real-Time Power BI Refresh – Visuals update instantly after refresh
This dashboard transforms raw KPI data into actionable intelligence.
What’s Inside the Asset Management Companies KPI Dashboard in Power BI 📂
You get a complete KPI monitoring framework with three well-structured pages:
📌 Summary Page
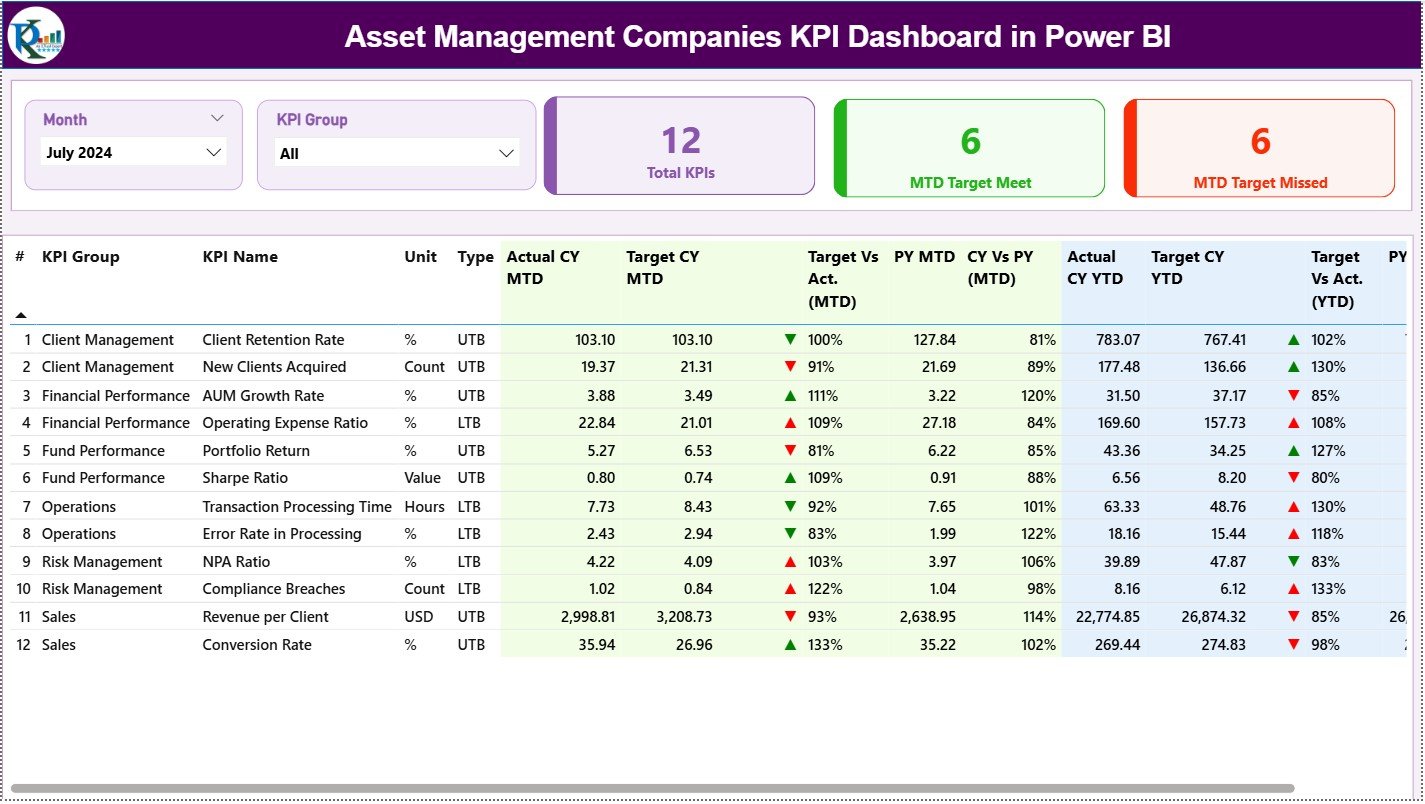
The main control panel featuring:
-
Month & KPI Group slicers
-
KPI cards (Total KPIs, MTD Target Met, MTD Target Missed)
-
A detailed KPI table with MTD, YTD, Target vs Actual, CY vs PY, and visual arrows (▲ ▼)
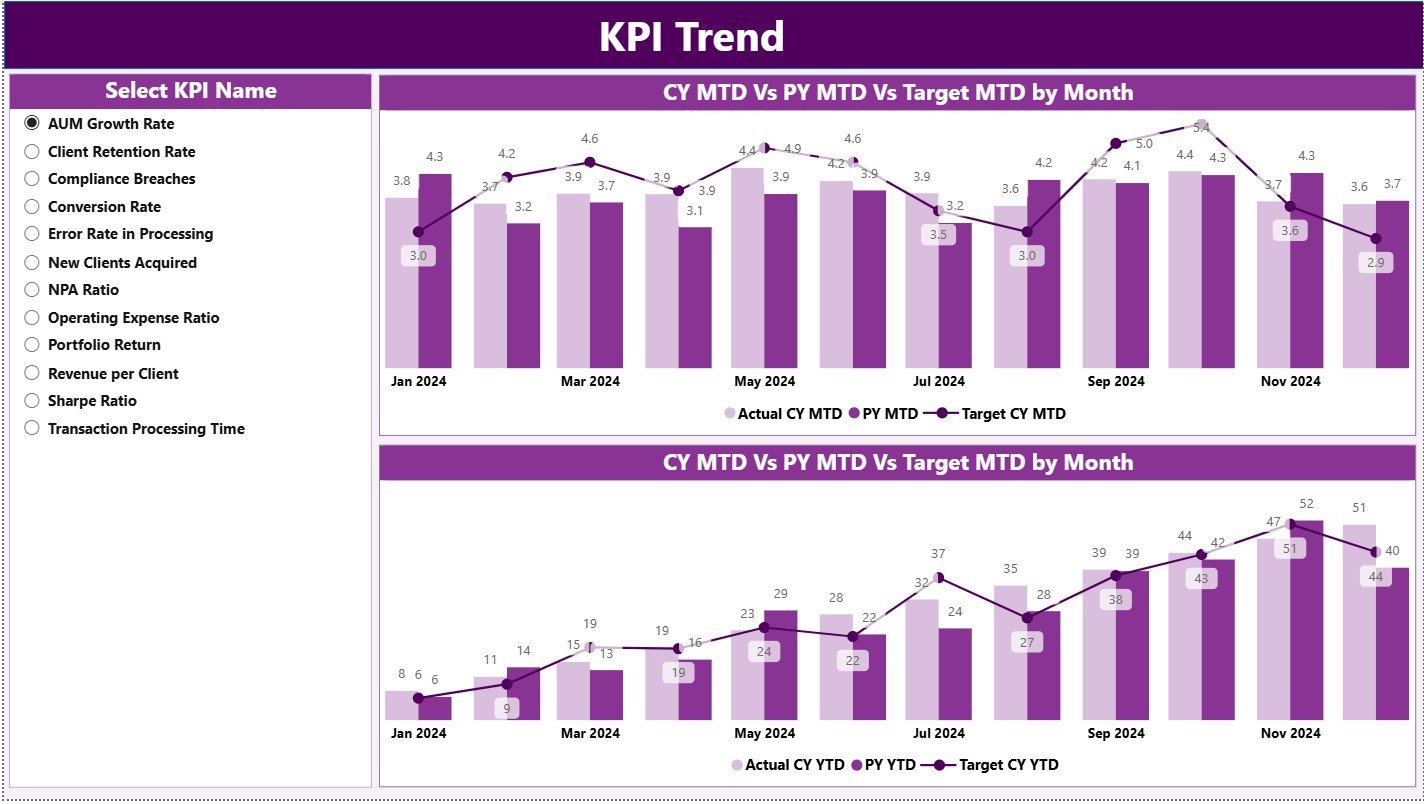
📌 KPI Trend Page
Designed for time-based performance analysis:
-
KPI Name slicer
-
MTD Trend chart (Actual CY, Actual PY, Target)
-
YTD Trend chart (Actual CY, Actual PY, Target)
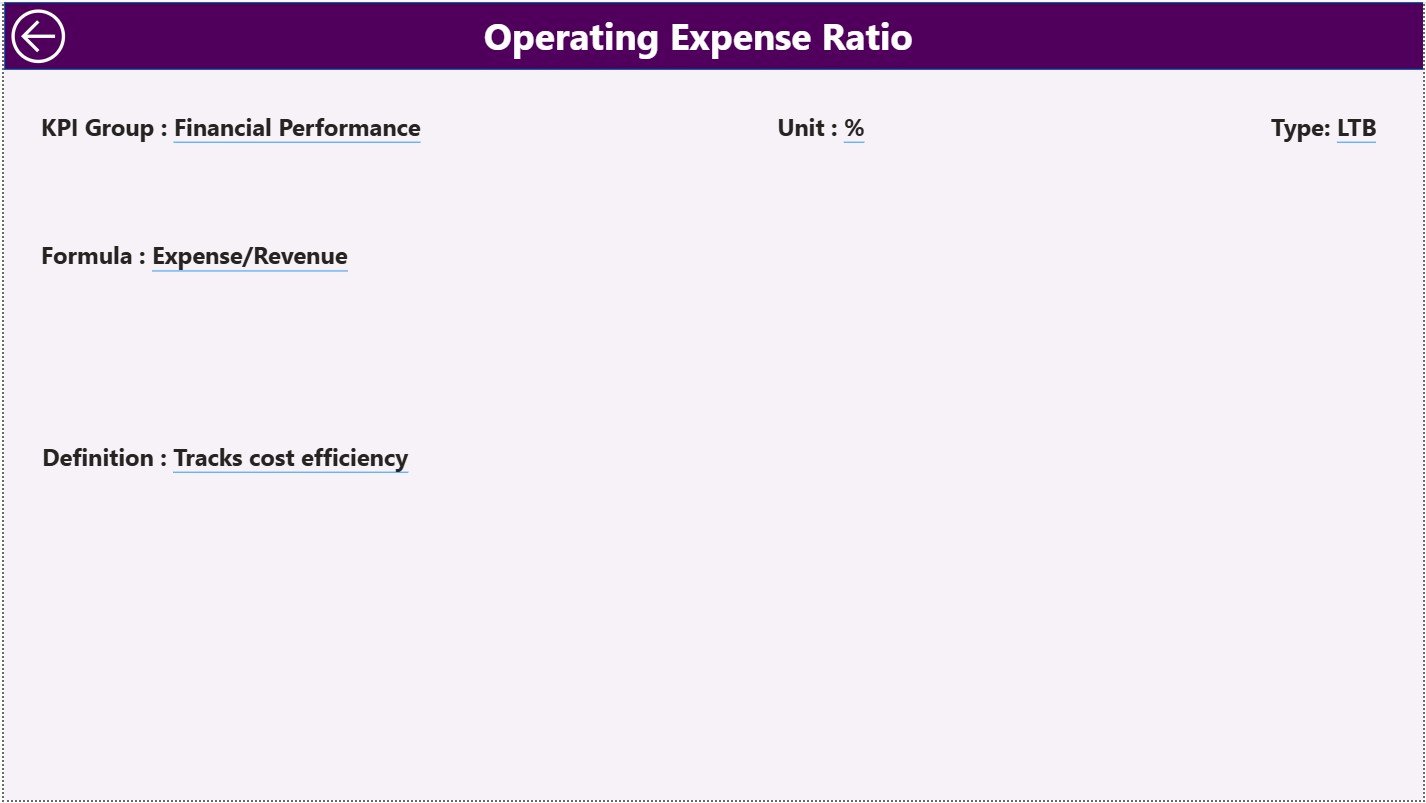
📌 KPI Definition Page
A drill-through governance page showing:
-
KPI Number, Group, Name
-
Unit, Formula, Definition
-
KPI Type (UTB / LTB)
Additionally, the dashboard is powered by a structured Excel data model with:
✔ Input Actual sheet
✔ Input Target sheet
✔ KPI Definition sheet
This structure ensures accuracy, consistency, and easy maintenance.
How to Use the Asset Management Companies KPI Dashboard in Power BI 🛠️
Using the dashboard is simple and user-friendly:
1️⃣ Update actual KPI values in the Excel Input Actual sheet
2️⃣ Enter targets in the Input Target sheet
3️⃣ Maintain KPI logic in the KPI Definition sheet
4️⃣ Refresh the Power BI file
5️⃣ Use slicers to analyze KPIs by Month or Group
6️⃣ Review KPI cards and performance indicators
7️⃣ Analyze trends and drill through KPI definitions when required
Within minutes, teams get accurate, board-ready insights—without manual reporting. ⚡
Who Can Benefit from This Asset Management KPI Dashboard? 👥
This dashboard is ideal for all stakeholders involved in asset management:
💼 Asset Management Executives – Monitor overall performance at a glance
📈 Portfolio Managers – Track trends and performance consistency
📊 Performance & Risk Analysts – Identify gaps and improvement areas
🧮 Finance & Operations Teams – Monitor targets, actuals, and variance
🛡️ Compliance & Reporting Teams – Ensure transparency and accountability
📑 Strategy & Planning Teams – Support long-term, data-driven decisions
If your organization wants clarity, control, and faster insights—this dashboard is essential.


Reviews
There are no reviews yet.