

🔑 Key Features of Amazon FBA Seller Dashboard in HTML
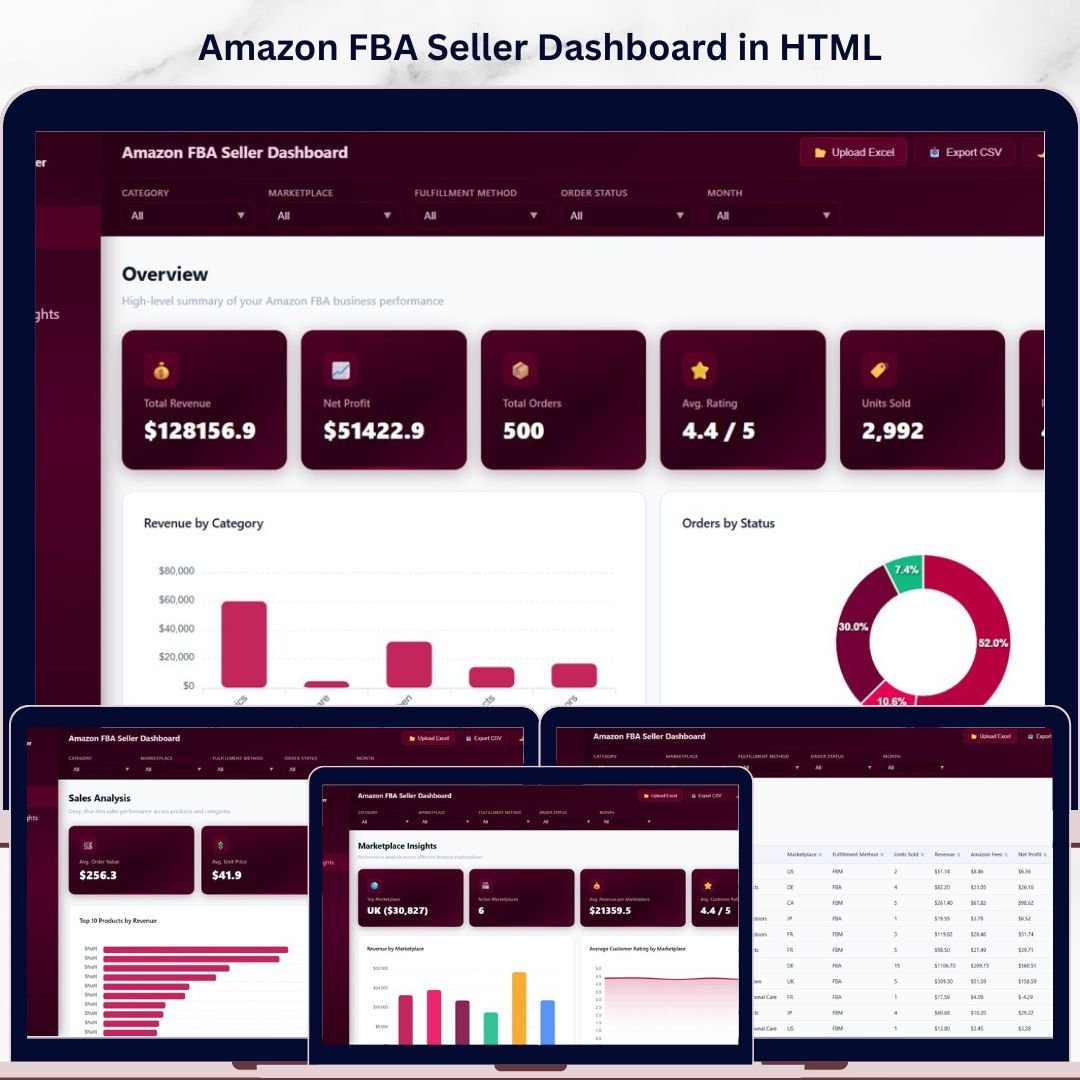
Amazon FBA Seller Dashboard in HTML is a powerful, browser-based interactive analytics template built specifically for Amazon FBA sellers, private label brands, and wholesale distributors who need a comprehensive view of their Amazon business performance without installing any software. This ready-to-use HTML dashboard includes 5 interactive pages — Overview, Sales Analysis, Marketplace Insights, Profitability, and Data View — giving you complete visibility into revenue, orders, profitability, customer ratings, and marketplace performance from a single browser window 🚀. If you prefer working in other platforms, explore the Amazon FBA Seller Dashboard in Excel, Amazon FBA Seller Dashboard in Power BI, or Amazon FBA Seller Dashboard in Google Sheets.
This Amazon FBA Seller Dashboard in HTML tracks 6 key performance indicators including Total Revenue, Net Profit, Total Orders, Average Rating, Units Sold, and Profit Margin. It features over 12 analytical charts across 4 dashboard pages with dynamic slicers and filters to drill down by category, marketplace, fulfillment method, and time period. The Data View page includes search, sort, pagination, and CSV export for detailed record-level analysis. Whether you sell on Amazon US, UK, Canada, or multiple global marketplaces, this dashboard consolidates all your FBA data into actionable visual insights. Browse more HTML Dashboard Templates for other business needs.
📦 What’s Inside the Amazon FBA Seller Dashboard in HTML
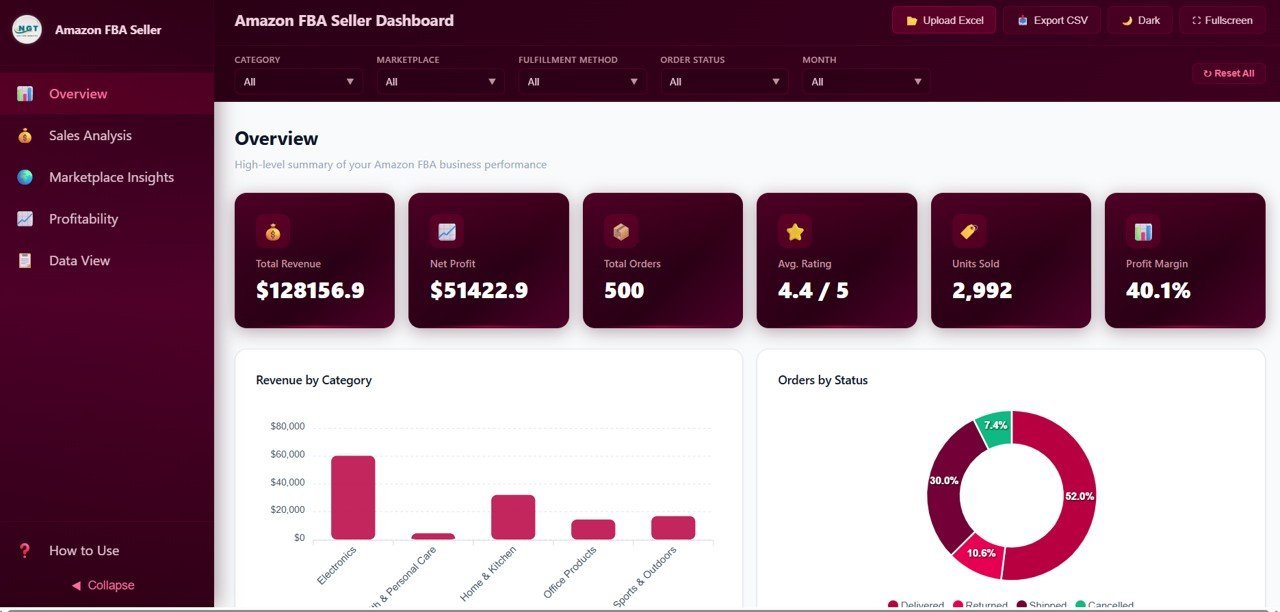
📊 Overview Page — The central hub displays 6 KPI cards (Total Revenue, Net Profit, Total Orders, Avg. Rating, Units Sold, Profit Margin) at the top for a quick snapshot of your Amazon FBA business health. Below the cards, you will find Revenue by Category showing earnings across different product categories, Orders by Status breaking down orders into shipped, pending, cancelled, and returned, Monthly Revenue Trend tracking your income trajectory over time, and Revenue by Marketplace comparing performance across Amazon US, UK, Canada, and other regions. Multiple slicers let you filter the entire dashboard instantly.
 Amazon FBA Seller Dashboard – Overview
📈 Sales Analysis Page — Dive deep into your Amazon sales with Top 10 Products by Revenue highlighting your best sellers, Units Sold by Category revealing which product lines move the most volume, Average Unit Price by Category helping you optimize pricing strategy, and Revenue by Fulfillment Method comparing FBA vs FBM vs SFP performance.
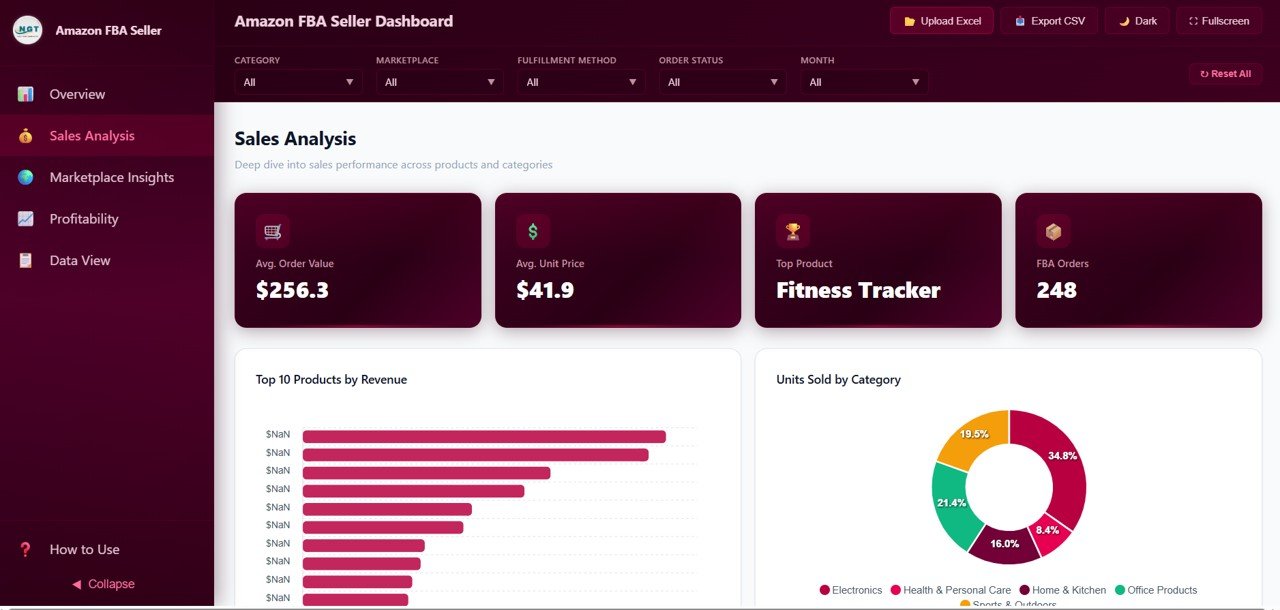 Amazon FBA Seller Dashboard – Sales Analysis
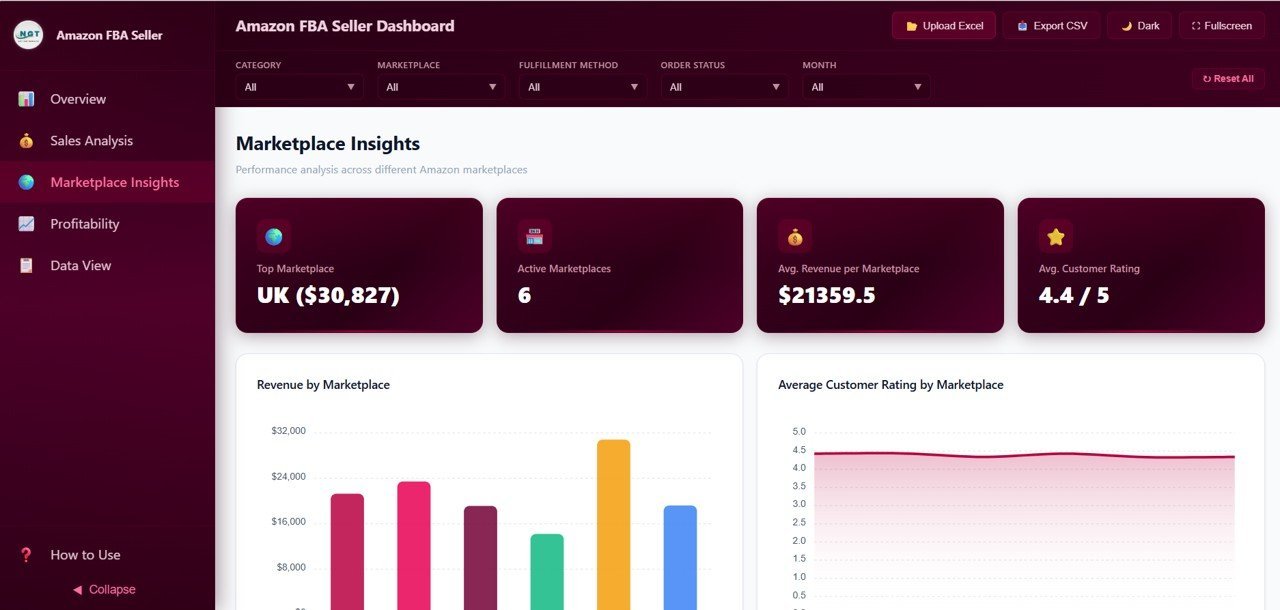
🌍 Marketplace Insights Page — Compare performance across global Amazon marketplaces with Revenue by Marketplace, Average Customer Rating by Marketplace, Orders by Marketplace and Status, and Net Profit by Marketplace. This page helps you identify which regions deliver the highest margins and satisfaction scores.
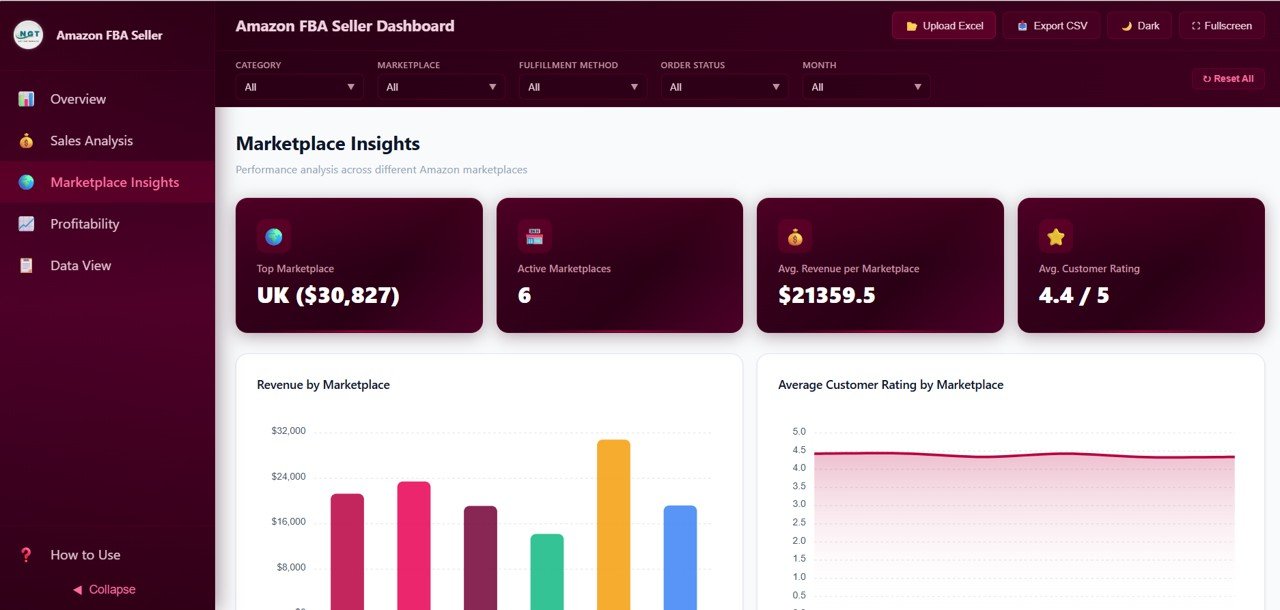 Amazon FBA Seller Dashboard – Marketplace Insights
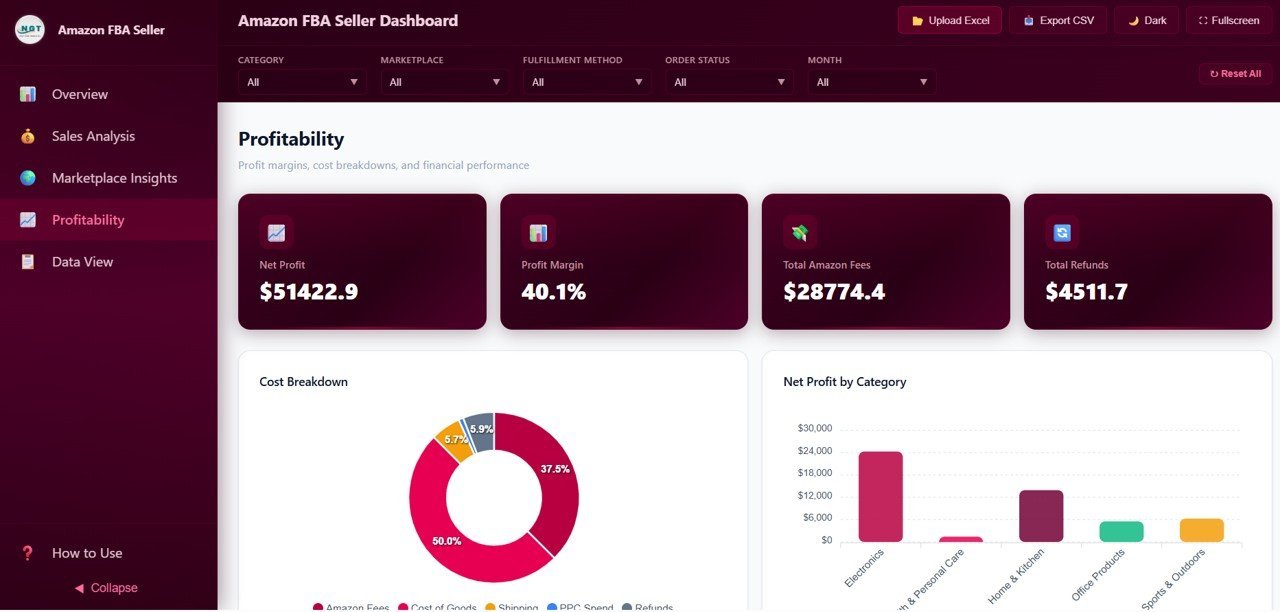
💰 Profitability Page — The true measure of FBA success is profit, and this page provides full transparency with Cost Breakdown showing Amazon fees, shipping, COGS, and advertising spend, Net Profit by Category identifying your most profitable product lines, Monthly Profit Trend tracking earnings over time, and Profit Margin by Product pinpointing which SKUs deliver the highest returns.
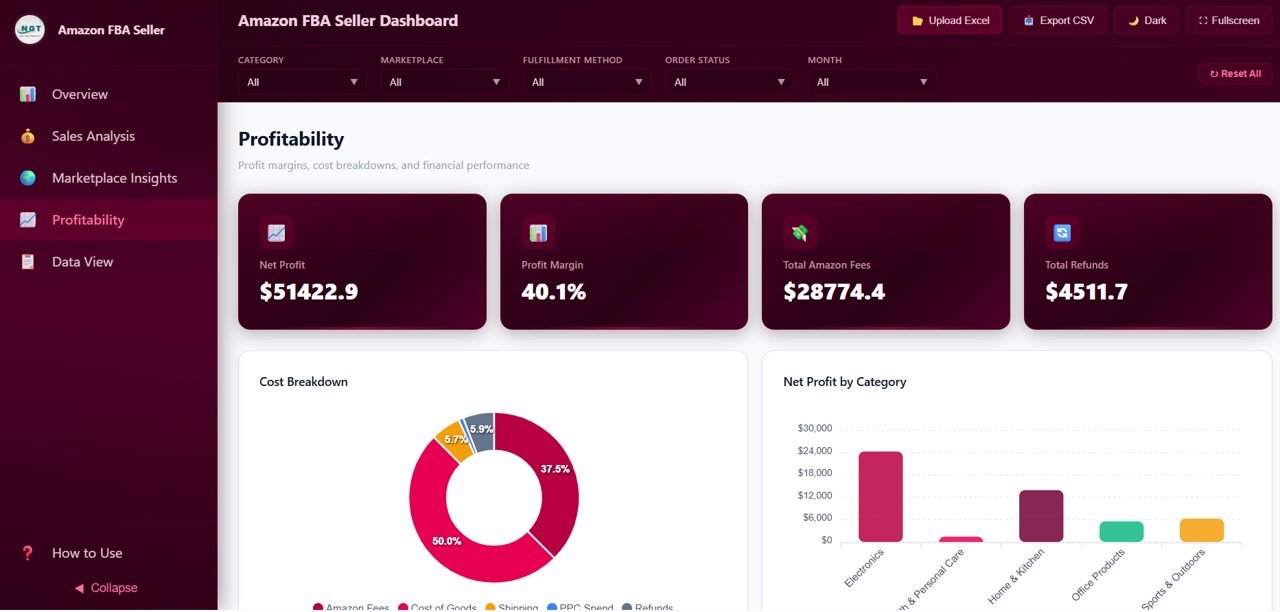 Amazon FBA Seller Dashboard – Profitability
📋 Data View Page — A detailed data table page with full search, sort, and pagination features. You can filter records by any column, navigate through pages, and export the filtered data to CSV for accounting, tax filings, or deeper analysis in Excel or Google Sheets.
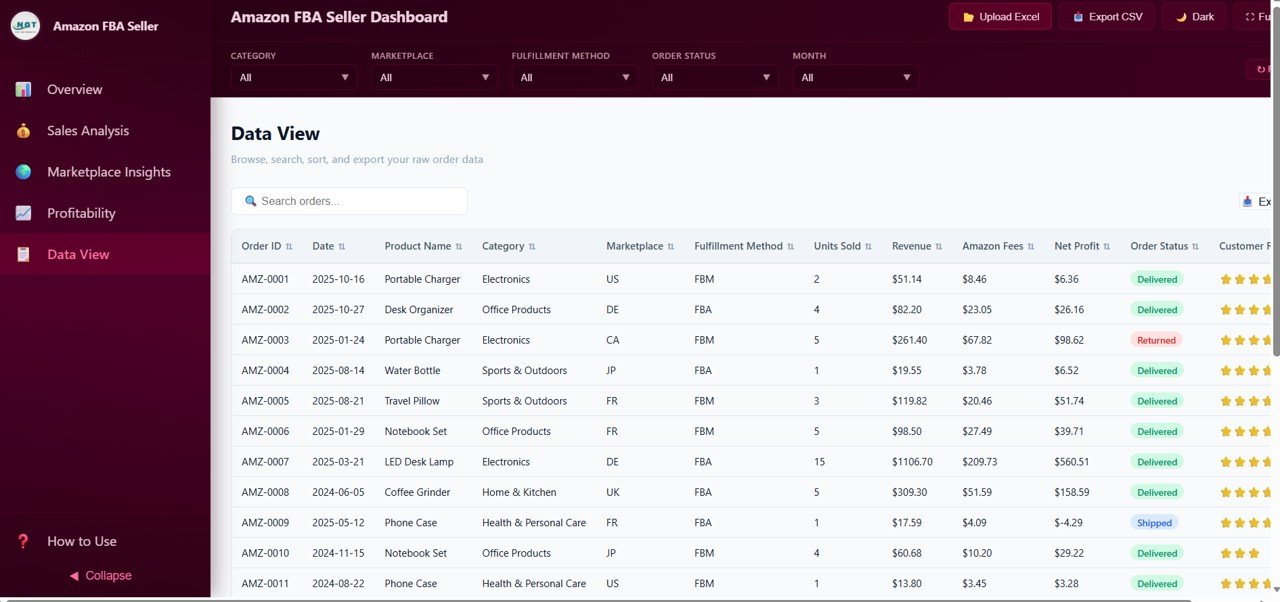 Data View
⚙️ How to Use the Amazon FBA Seller Dashboard in HTML
1️⃣ Download and unzip the template file to your computer
2️⃣ Open index.html in any modern browser (Chrome, Edge, Firefox, Safari)
3️⃣ Replace the sample data in the data file with your own Amazon FBA order data
4️⃣ All 5 dashboard pages update automatically with your data — charts, KPI cards, and filters refresh instantly
5️⃣ Use the slicers and filters to drill down by category, marketplace, fulfillment method, and time period
6️⃣ Export filtered data to CSV from the Data View page for tax or accounting purposes
👥 Who Can Benefit from This Amazon FBA Seller Dashboard
🔹 Amazon FBA private label sellers tracking multi-product performance
🔹 Wholesale distributors managing inventory and margins across categories
🔹 E-commerce managers overseeing Amazon operations across multiple marketplaces
🔹 Financial analysts monitoring FBA profitability and cost breakdowns
🔹 Startup sellers who want professional analytics without expensive software subscriptions
🔹 Accountants and bookkeepers who need exportable Amazon sales data for tax season
❓ Frequently Asked Questions
What KPIs does the Amazon FBA Seller Dashboard in HTML track?
The Amazon FBA Seller Dashboard in HTML tracks 6 key performance indicators: Total Revenue, Net Profit, Total Orders, Average Rating, Units Sold, and Profit Margin. These KPIs are displayed as cards on the Overview page and update dynamically based on your data and filter selections.
Do I need any software to use this Amazon FBA HTML dashboard?
No. This is a browser-based HTML dashboard that works directly in Chrome, Edge, Firefox, or Safari. There is no software to install, no subscriptions, and no plugins required. Simply open the file and start analyzing your Amazon FBA data.
Can I track multiple Amazon marketplaces with this dashboard?
Yes. The Marketplace Insights page compares revenue, orders, ratings, and net profit across all your Amazon marketplaces including US, UK, Canada, Germany, and more. You can instantly see which regions deliver the best performance.
How do I add my own Amazon FBA data to this dashboard?
Replace the sample data in the included data file with your own Amazon FBA order export. All charts, KPI cards, and filters will automatically refresh with your real business data. No coding or technical skills are needed.
Can I export data from this dashboard?
Yes. The Data View page includes a CSV export feature that lets you download filtered and sorted data for further analysis in Excel, Google Sheets, or for sharing with your accountant.
Is there an Excel or Power BI version of this Amazon FBA dashboard?
Yes. NextGenTemplates offers the Amazon FBA Seller Dashboard in four formats: HTML (browser-based), Excel (spreadsheet), Power BI (advanced analytics), and Google Sheets (cloud-based).
🔗 Explore Related Templates
🔹 Etsy Seller Analytics Dashboard in HTML — Browser-based Etsy shop analytics with 5 pages covering sales, traffic, engagement, and profitability.
🔹 Sales and Revenue Command Center Dashboard in HTML — Comprehensive HTML sales dashboard for tracking revenue, pipeline, and team performance.
🔹 Small Business CFO Dashboard in HTML — Financial overview dashboard covering P&L, cash flow, and expense tracking for small business owners.
📖 Click here to read the Detailed Blog Post
🎥 Visit our YouTube channel to learn step-by-step video tutorials
👉 YouTube.com/@NextGenTemplates
Watch the step-by-step video tutorial:
YouTube


Reviews
There are no reviews yet.