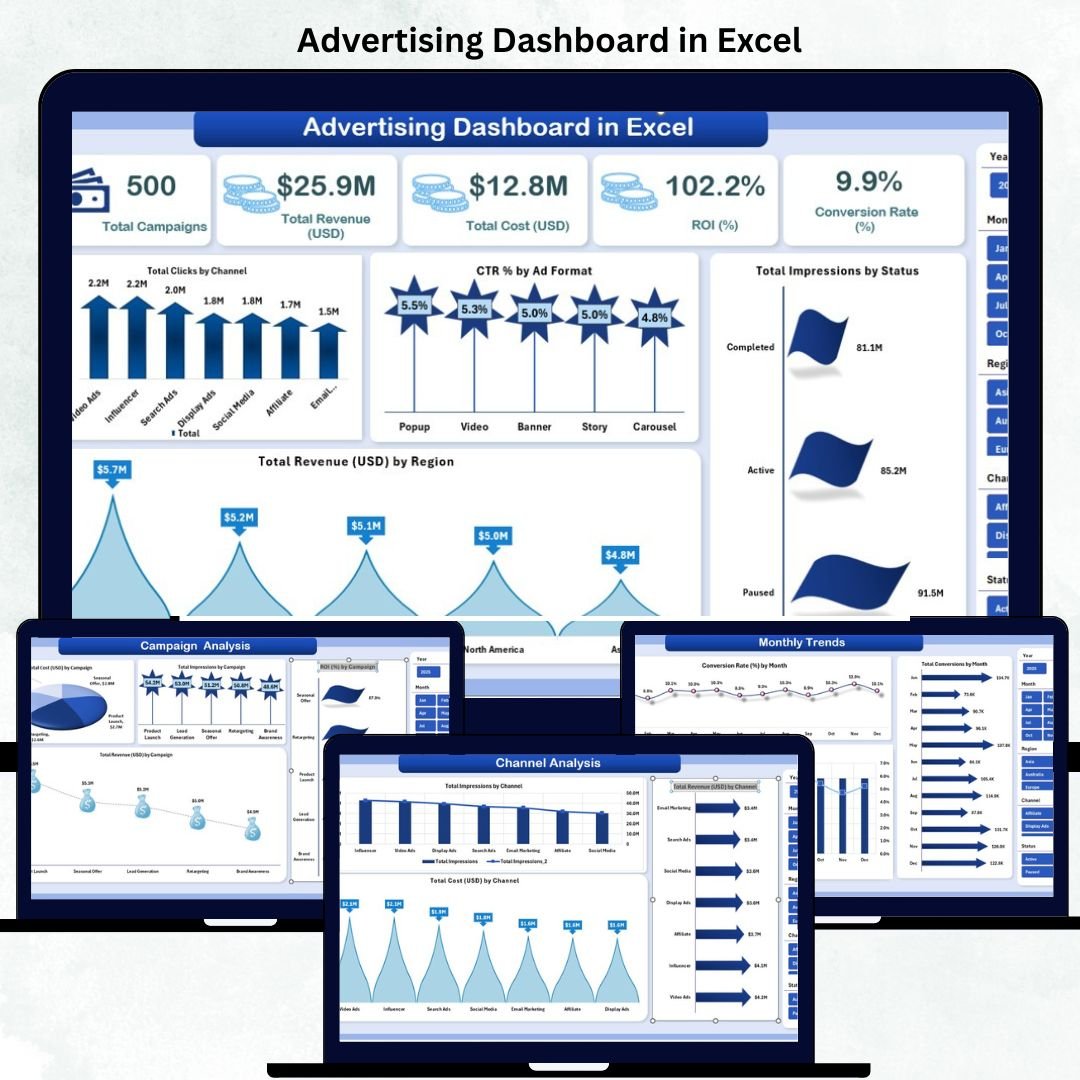
In today’s competitive digital marketing landscape, tracking campaign results is no longer optional — it’s essential. That’s where the ✨ Advertising Dashboard in Excel ✨ becomes your ultimate solution. Designed for marketing agencies, freelancers, and in-house teams, this ready-to-use Excel dashboard helps you monitor ad performance, ROI, and conversion rates — all in one place. No coding, no expensive software — just pure Excel power!
✨ Key Features of Advertising Dashboard in Excel
📊 Comprehensive Campaign Overview – Instantly see your total campaigns, ad spend, ROI, and conversions on one clean dashboard.
💰 ROI & Conversion Tracking – Automatically calculates your Return on Investment (%) and Conversion Rate (%).
🧩 Multi-Channel Insights – Evaluate how Google Ads, Facebook, Instagram, and LinkedIn perform side by side.
🌍 Regional Performance – Identify which regions drive maximum engagement and revenue.
📈 Visual Storytelling with Charts – View campaign trends, CTR by format, and monthly performance through dynamic charts.
🧮 Automated Calculations – Built-in Excel formulas handle CTR, ROI, and conversion rates — no manual effort needed.
🎯 Customizable Filters – Slice your data by campaign, channel, month, or region using dropdown menus.
🔒 Data Security & Portability – Keep sensitive marketing data offline and share securely through Excel.
💡 No Subscription Needed – Once downloaded, you can use it forever — no hidden costs.
📦 What’s Inside the Advertising Dashboard in Excel
When you open the file, you’ll find multiple well-structured sheets designed for performance tracking:
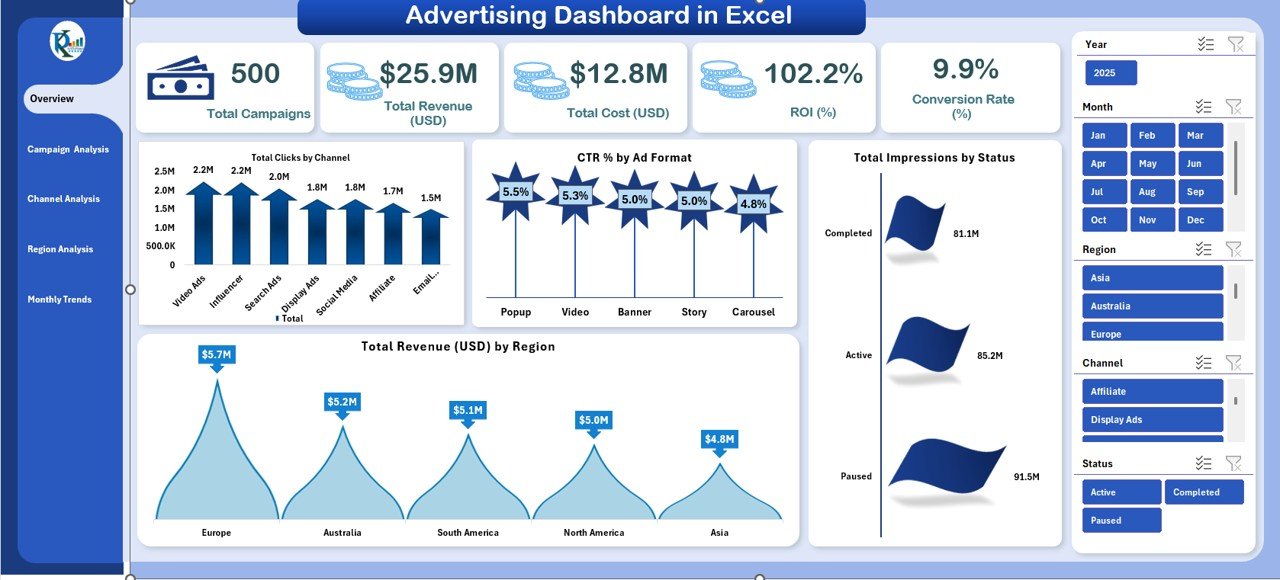
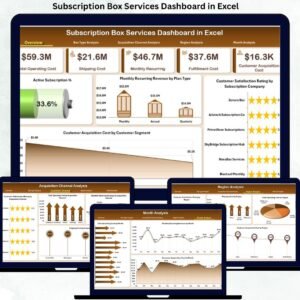
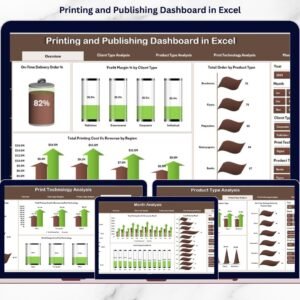
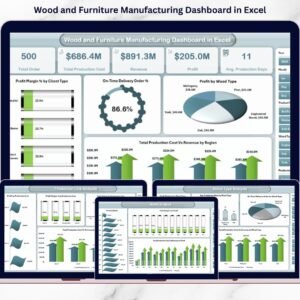
1️⃣ Overview Sheet – The main interface with KPI cards for Total Campaigns, Total Revenue, Total Cost, ROI (%), and Conversion Rate (%). It also includes bar and column charts for Clicks by Channel, CTR by Ad Format, and Revenue by Region.
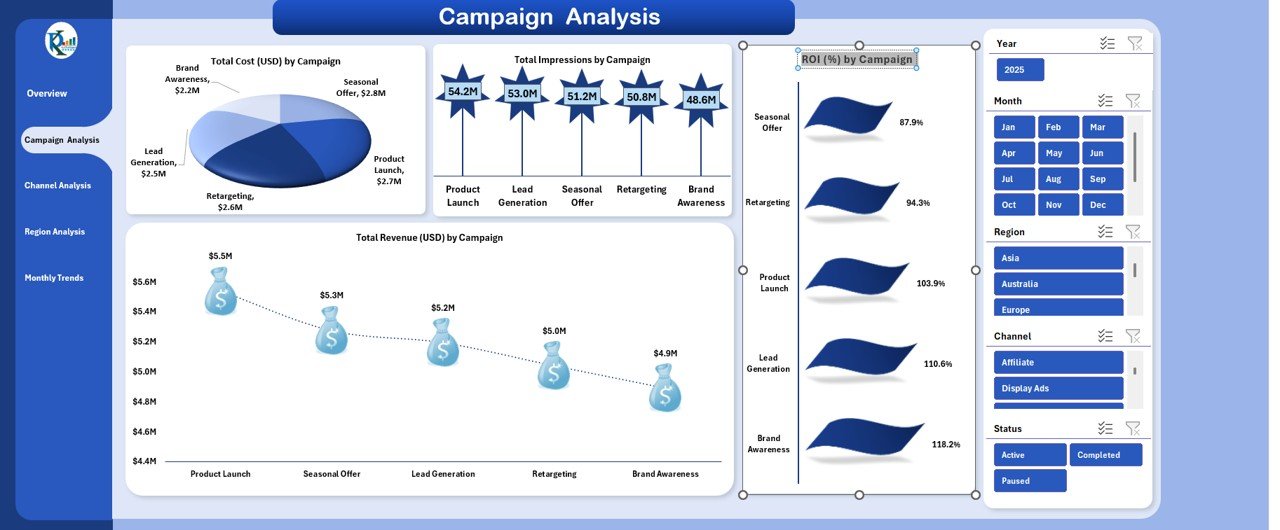
2️⃣ Campaign Analysis Sheet – Dive deep into each campaign’s performance. Compare Impressions, Revenue, and ROI across different campaigns and periods.
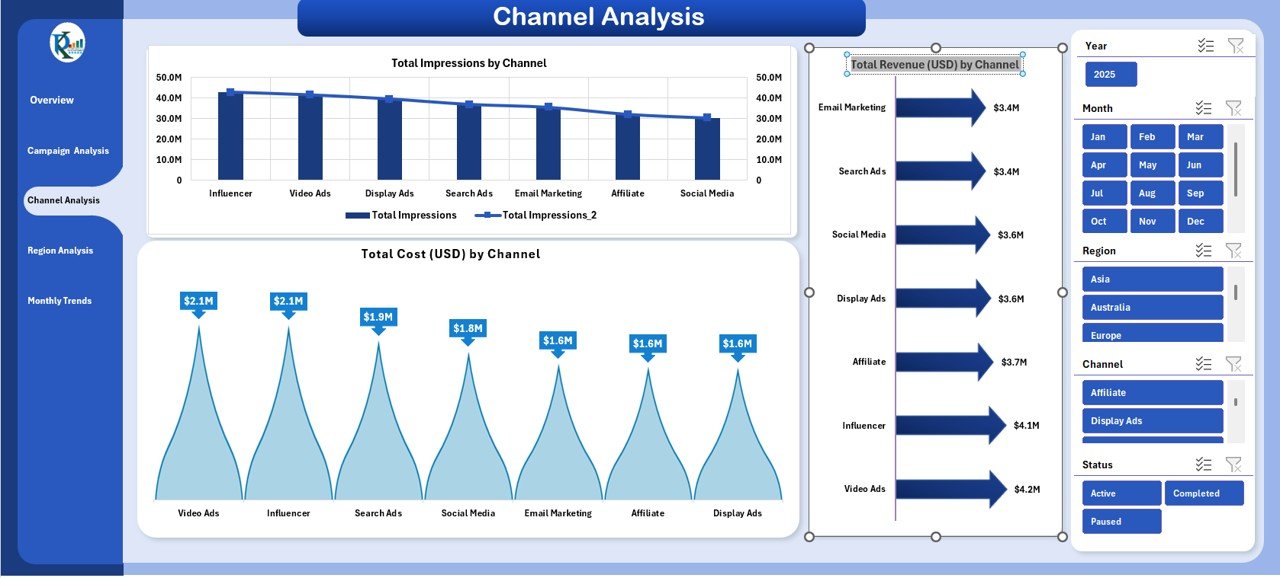
3️⃣ Channel Analysis Sheet – See which platforms deliver the best ROI and engagement. Compare cost, impressions, and conversions across Google, Facebook, Instagram, or LinkedIn.
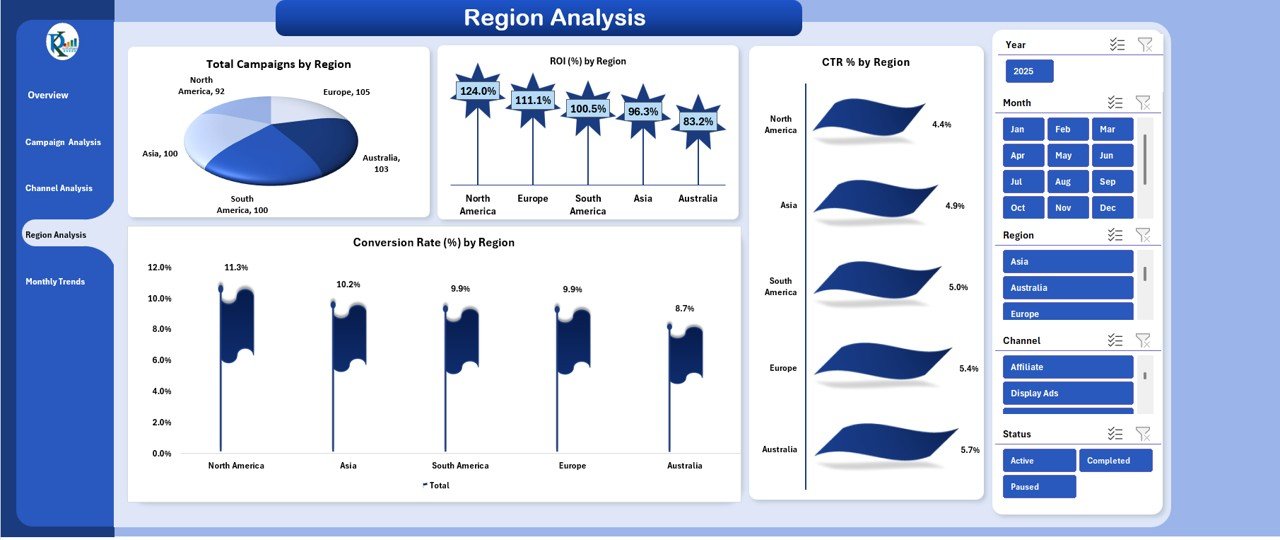
4️⃣ Region Analysis Sheet – Evaluate performance by geography — identify the top-performing regions with the highest CTR and Conversion Rate.
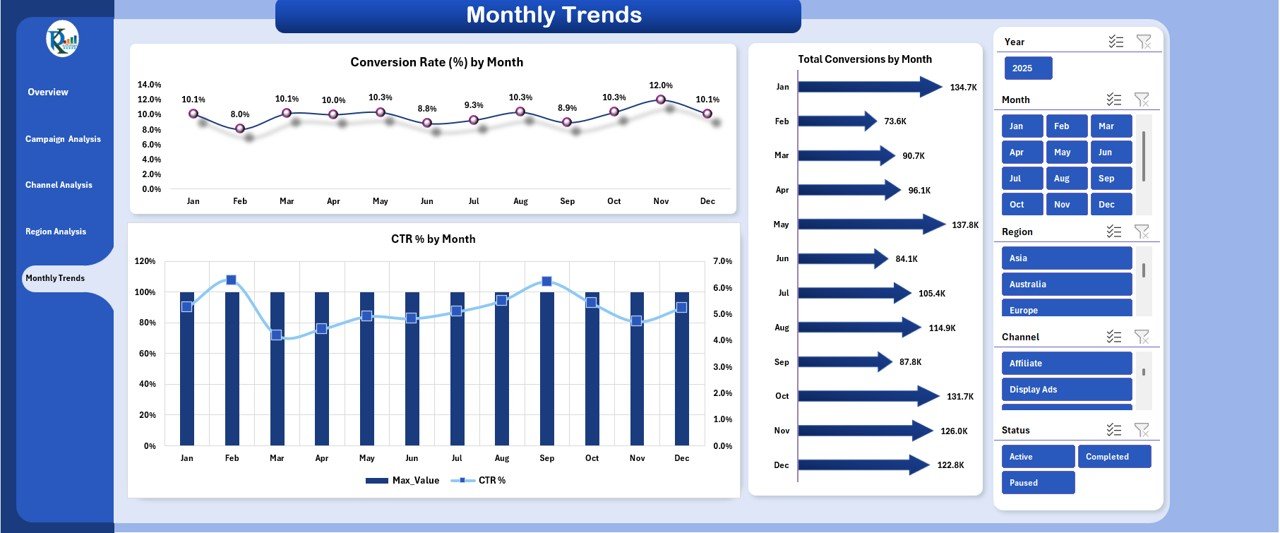
5️⃣ Monthly Trends Sheet – Analyze your advertising performance month-by-month. Track conversions, CTR %, and seasonal variations to optimize future ad budgets.
Each sheet is fully editable, allowing you to customize KPIs, add formulas, or modify visuals based on your business goals.
⚙️ How to Use the Advertising Dashboard in Excel
🚀 Step 1: Enter your campaign data — impressions, clicks, cost, revenue, and conversions — in the input tables.
🎛️ Step 2: Use dropdown filters to select month, campaign, or region for instant analysis.
📈 Step 3: Review KPIs on the Overview Sheet to assess ROI and CTR performance.
🔍 Step 4: Drill down using Campaign or Channel Analysis to identify your best-performing ads.
📊 Step 5: Track trends over time in the Monthly Trends tab for smarter forecasting and strategy planning.
This step-by-step process turns raw ad data into actionable insights — all within Excel.
👥 Who Can Benefit from This Advertising Dashboard
💼 Digital Marketing Agencies: Manage multiple client campaigns efficiently with automated analytics.
🏢 In-House Marketing Teams: Monitor campaign ROI and conversion performance for every channel.
👩💻 Freelance Marketers: Simplify reporting and impress clients with clean, professional visuals.
🏪 Small Business Owners: Understand where your marketing budget goes and which ads deliver the best results.
🎓 Marketing Students or Analysts: Learn the art of ad data visualization and reporting using Excel.
With this dashboard, anyone can turn ad data into intelligent decisions — faster, smarter, and visually.
📘 Click here to read the Detailed blog post
Watch the step-by-step video tutorial:


Reviews
There are no reviews yet.