Corporate Secretarial KPI Dashboard teams sit at the center of governance, statutory compliance, and regulatory discipline. From tracking board compliances and statutory filings to monitoring deadlines and governance KPIs, even a small delay can expose organizations to penalties, audit risks, and reputational damage. However, when secretarial teams rely on scattered Excel trackers, emails, and manual reports, visibility drops and decision-making becomes reactive.
That is exactly where the Corporate Secretarial KPI Dashboard in Power BI becomes a powerful, modern, and audit-ready solution 📊⚖️.
This ready-to-use Power BI dashboard is designed specifically for corporate secretarial, compliance, and governance teams to monitor, analyze, and present KPI performance in a clear and structured way. Instead of reviewing static spreadsheets, teams can now view real-time KPI performance, target achievement, trends, and compliance risks on a single interactive dashboard.
Because this dashboard uses Excel as the data source, it remains extremely easy to maintain. Users simply update KPI actuals, targets, and definitions in Excel, refresh the Power BI file, and instantly get updated insights—without complex modeling or technical skills.
With interactive slicers, KPI cards, trend charts, and drill-through definitions, this dashboard helps teams move from manual tracking to proactive compliance management.
## ✨ Key Features of Corporate Secretarial KPI Dashboard in Power BI
This dashboard is built to support real-world secretarial and governance workflows.
📌 Centralized KPI Visibility
Track all corporate secretarial KPIs in one interactive Power BI dashboard.
📊 MTD & YTD Performance Tracking
Monitor Month-to-Date and Year-to-Date compliance effortlessly.
🎯 Target vs Actual Comparison
Instantly identify achieved and missed compliance targets.
🔁 Previous Year Benchmarking
Compare current performance with last year’s results.
🚦 Visual KPI Status Indicators
Green ▲ and red ▼ icons highlight risks instantly.
🧩 Excel-Based Data Input
No complex systems—just update Excel and refresh Power BI.
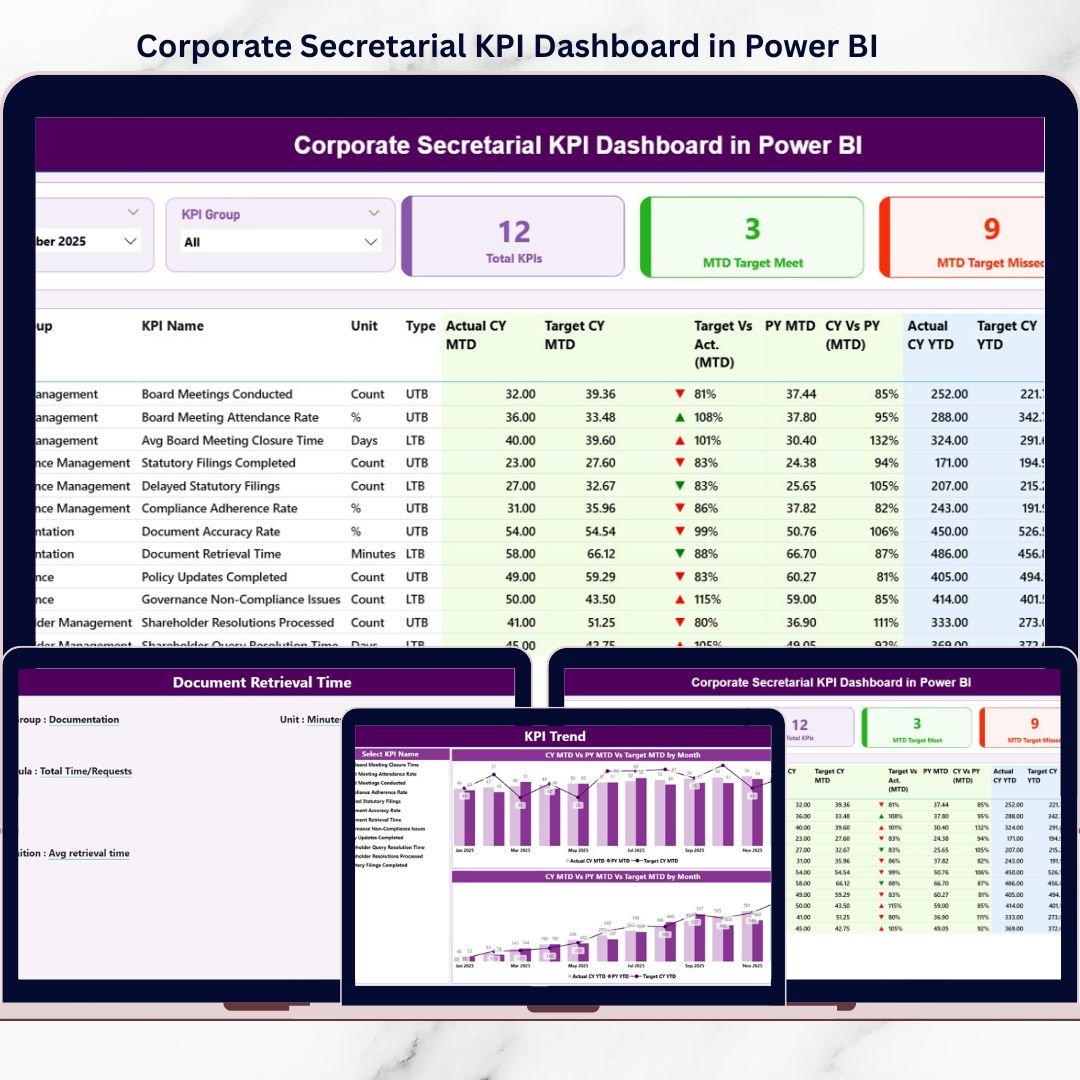
## 📂 What’s Inside the Corporate Secretarial KPI Dashboard in Power BI
This dashboard includes 3 professionally designed Power BI pages supported by structured Excel data sheets.
📊 Summary Page
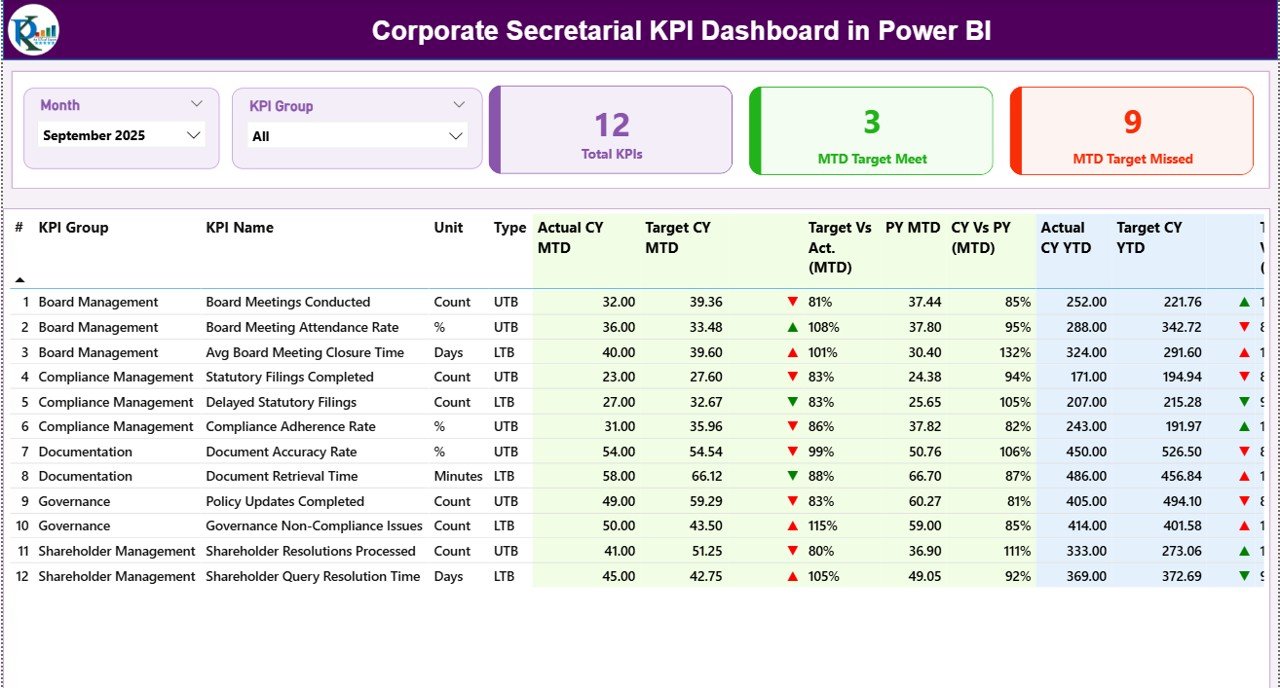
The main control panel showing:
-
Month & KPI Group slicers
-
Total KPIs, MTD Target Met, MTD Target Missed cards
-
Detailed KPI table with MTD & YTD performance
-
Target vs Actual and Previous Year comparisons
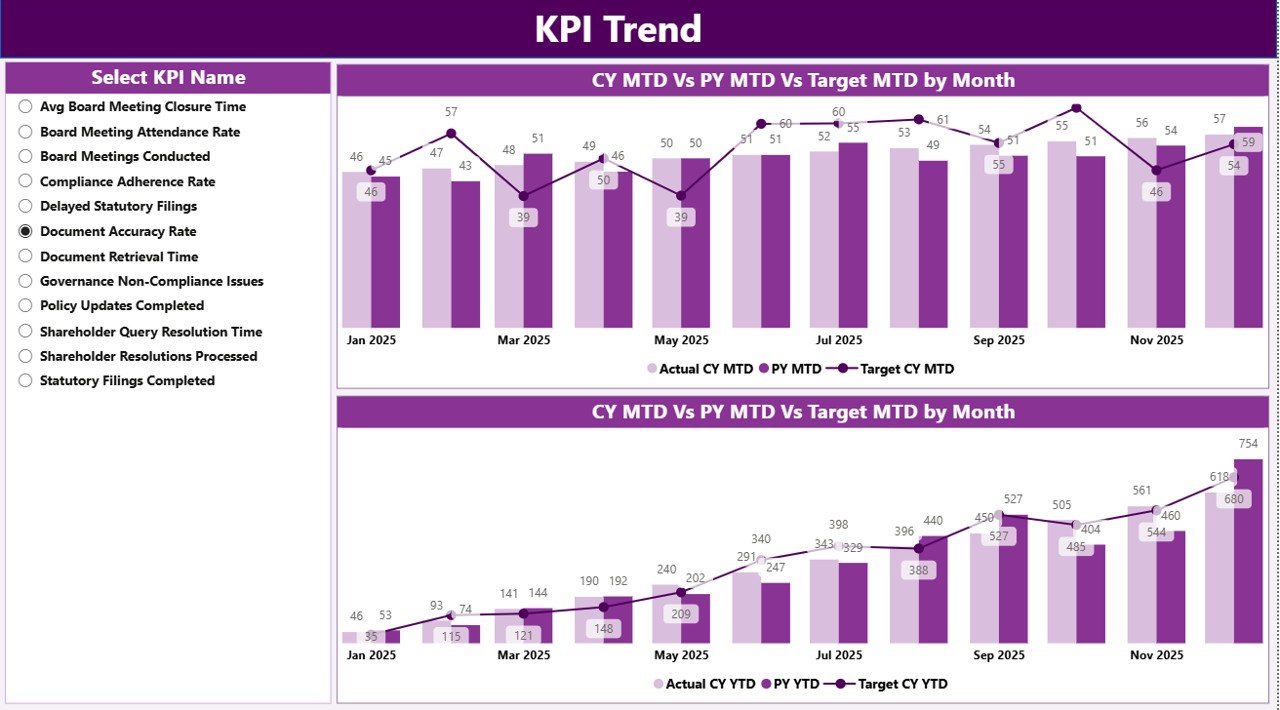
📈 KPI Trend Page
Focused KPI-level analysis with:
-
KPI Name slicer
-
MTD Trend chart (Actual vs Target vs PY)
-
YTD Trend chart (Actual vs Target vs PY)
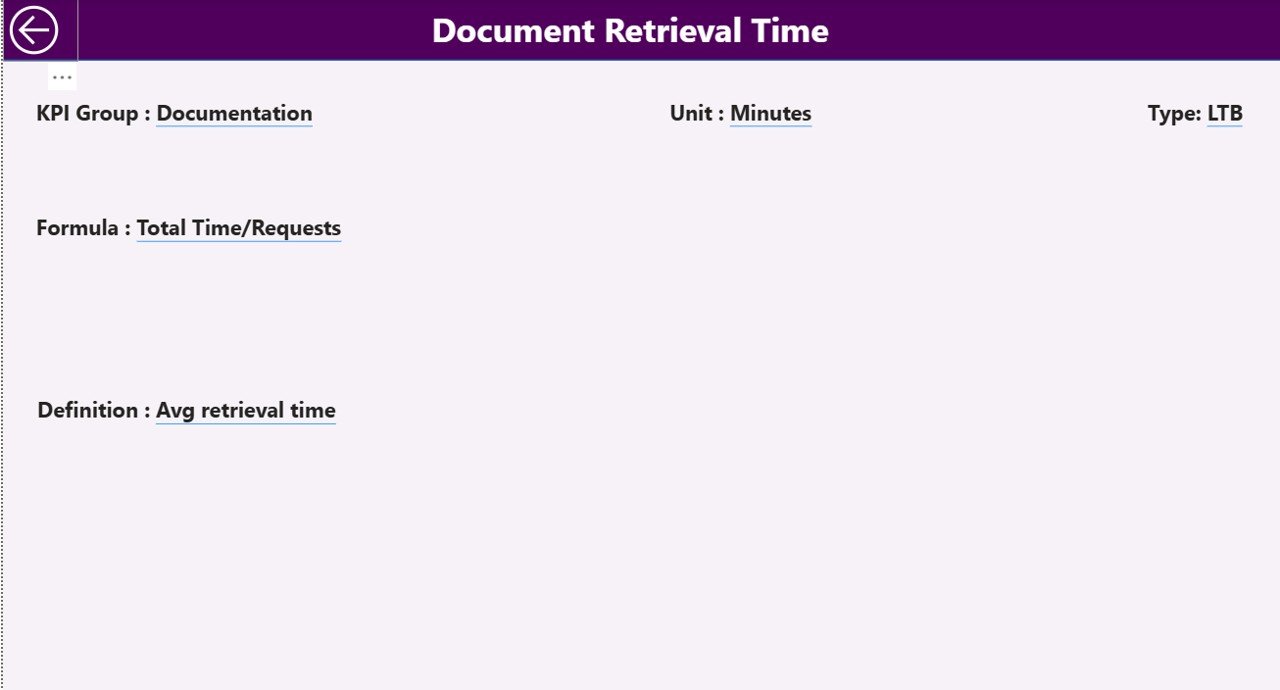
📘 KPI Definition Page (Drill-Through)
Clear governance layer showing:
-
KPI Formula
-
KPI Definition
-
KPI Unit & Type (LTB / UTB)
-
Back button for smooth navigation
📁 Excel Data Source Includes
-
Input_Actual Sheet
-
Input_Target Sheet
-
KPI Definition Sheet
This structure ensures clarity, transparency, and audit readiness.
## 🧩 How to Use the Corporate Secretarial KPI Dashboard in Power BI
Using the dashboard is simple and efficient:
1️⃣ Define KPIs, targets, and types in Excel
2️⃣ Enter monthly MTD and YTD actual values
3️⃣ Refresh the Power BI file
4️⃣ Select Month and KPI Group using slicers
5️⃣ Review compliance performance and trends
6️⃣ Use insights for audits, reviews, and board reporting
No advanced Power BI skills required.
## 👥 Who Can Benefit from This Corporate Secretarial KPI Dashboard
This dashboard is ideal for:
✔️ Corporate Secretarial Teams
✔️ Company Secretaries
✔️ Compliance & Governance Officers
✔️ Legal & Regulatory Teams
✔️ CFOs & Senior Management
✔️ Internal & External Auditors
Suitable for both SMEs and large enterprises.
### Click here to read the Detailed blog post
Visit our YouTube channel to learn step-by-step video tutorials
👉 https://youtube.com/@PKAnExcelExpert


Reviews
There are no reviews yet.