Museums and cultural centres hold a unique responsibility—protecting heritage, inspiring creativity, and enriching entire communities. But to fulfill this mission effectively, organizations must track dozens of KPIs, measure program outcomes, analyze visitor experience, and ensure operational efficiency. Manual reporting often leads to delays, inconsistent insights, and unclear decision-making pathways.
The Museums & Cultural Centres KPI Dashboard in Power BI solves these challenges instantly. Museums & Cultural Centres KPI Dashboard in Power BI It transforms complex datasets into clear visuals, real-time comparisons, and actionable insights that help museum leaders understand what’s working, what needs improvement, and how to enhance cultural impact. With automated refreshes, interactive slicers, and user-friendly pages, Museums & Cultural Centres KPI Dashboard in Power BI this dashboard empowers institutions to make confident, data-driven decisions every month. 🚀
Whether you’re tracking visitor trends, cultural program outcomes, operational KPIs, or financial metrics, this dashboard becomes your all-in-one performance intelligence system.
Key Features of the Museums & Cultural Centres KPI Dashboard in Power BI ✨
Here’s everything that makes this dashboard a must-have for cultural organizations:
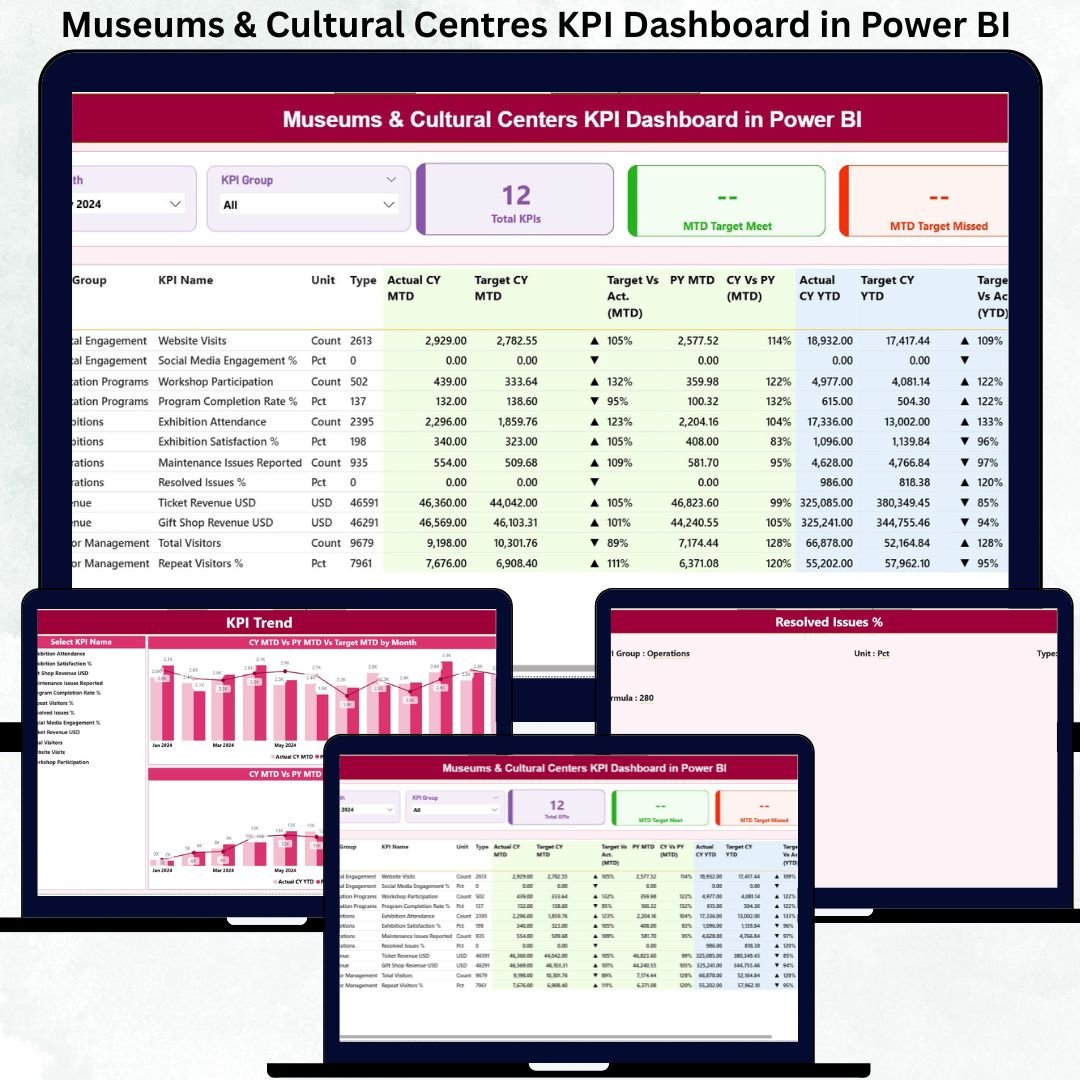
✨ 3 Insight-Rich Pages – Summary, KPI Trends & KPI Definition
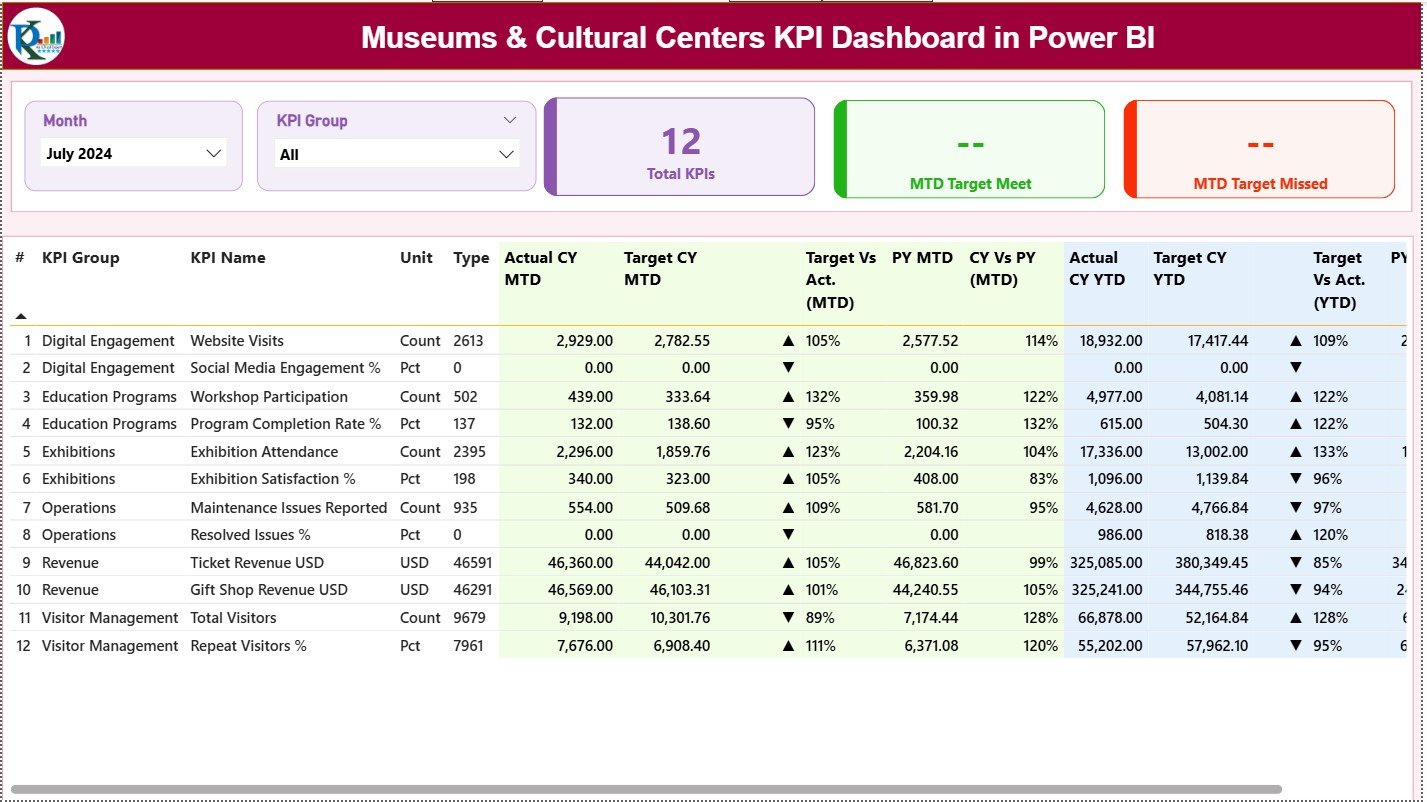
📊 Automated KPI Cards – Quickly see Total KPIs, Target Met Count & Target Missed Count
🖥️ Interactive Filters – Choose months or KPI groups to analyze performance instantly
📈 MTD & YTD Variance Tracking – Compare current performance with targets and the previous year
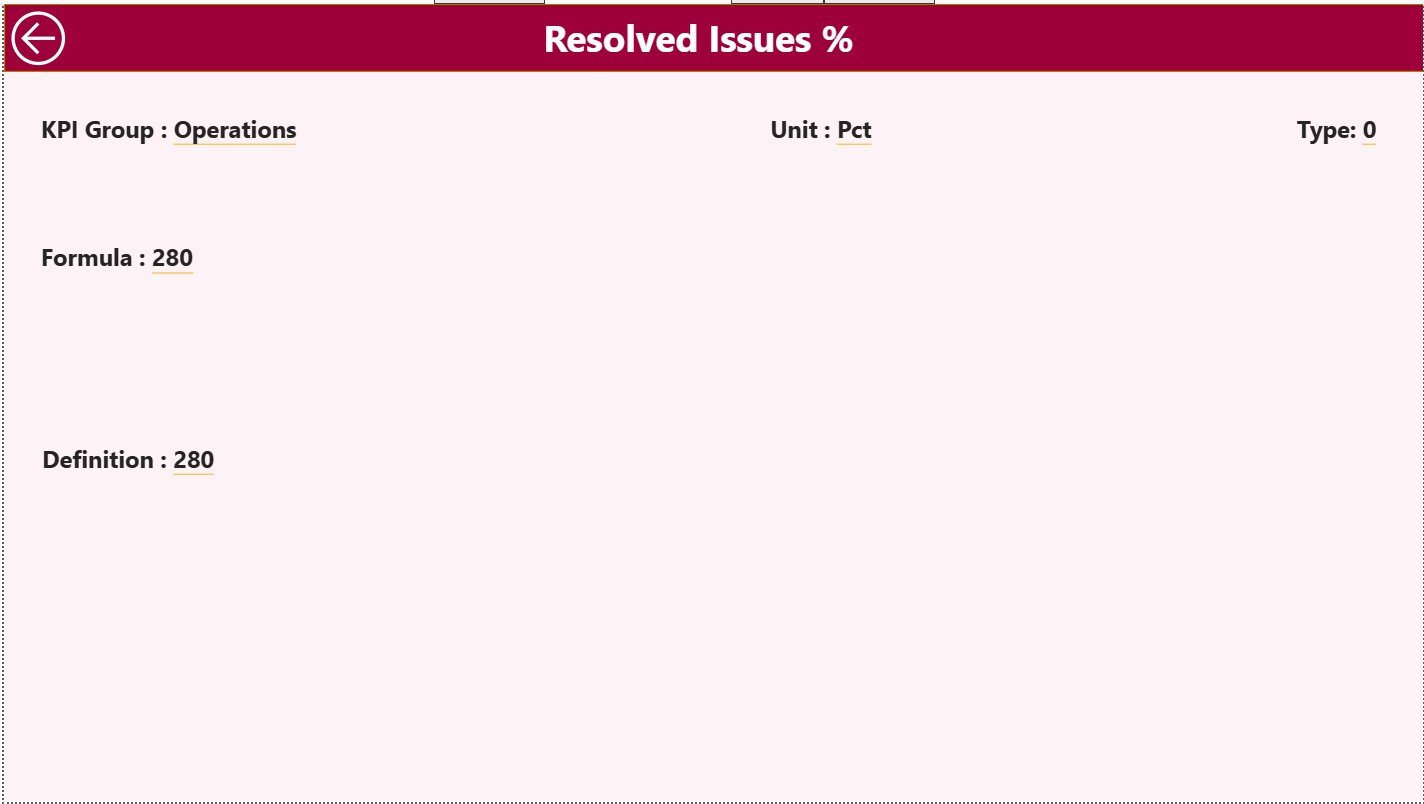
🔍 Drill-Through KPI Definition Page – Understand formulas, measurement logic & KPI types
📘 Excel-Based Data Model – Simple data entry with instant Power BI refresh
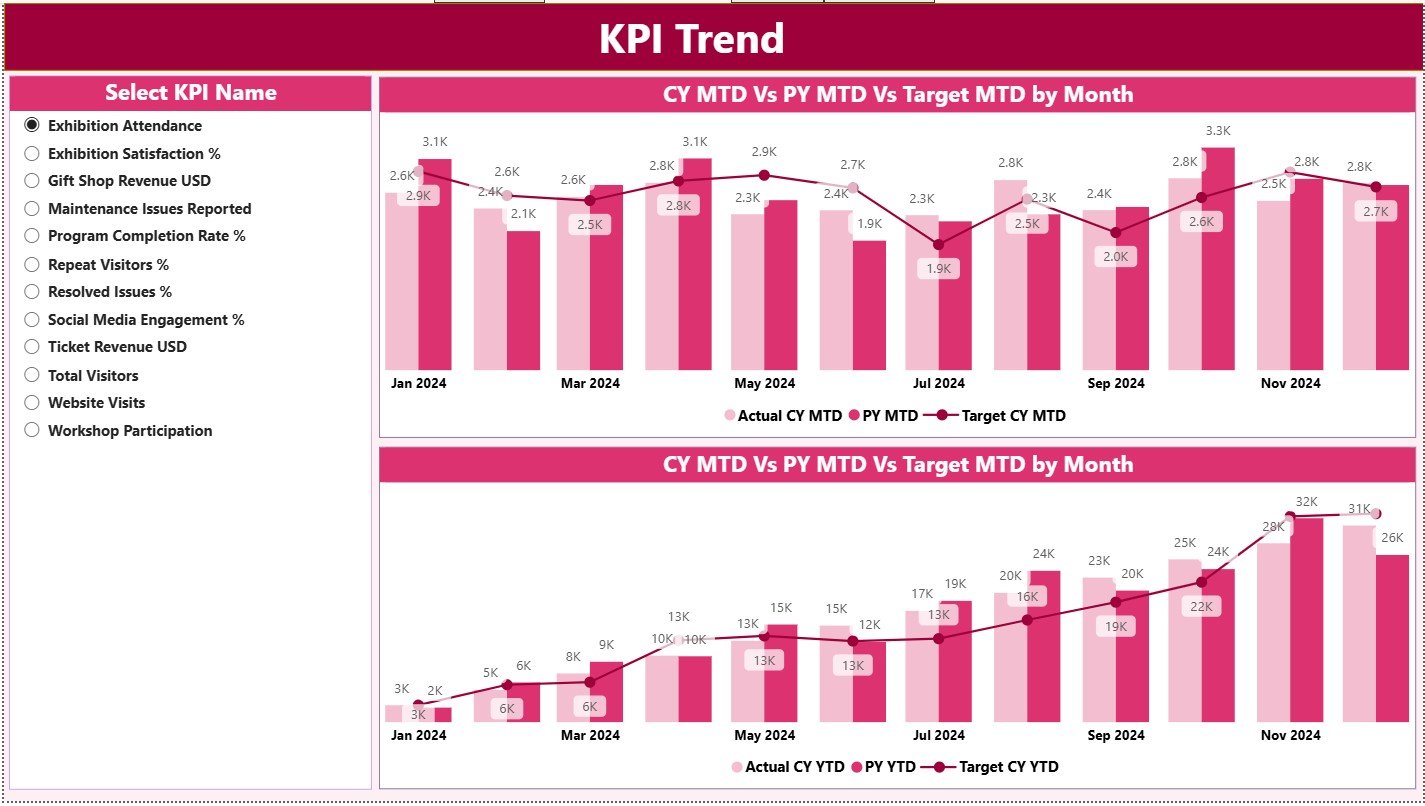
💡 Trend Analysis Tools – View historical behavior for better planning
📉 Performance Icons & Color Indicators – Identify good or bad performance quickly
🔄 Real-Time Reporting – No more manual sheets or outdated numbers
This dashboard brings transparency, speed, and clarity to museum performance tracking.
What’s Inside the Museums & Cultural Centres KPI Dashboard in Power BI 📂
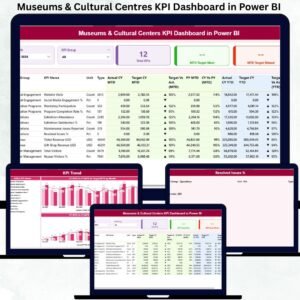
The dashboard includes three well-designed analytical pages:
📌 Summary Page – Your main overview with KPI cards, performance tables, and filters
📌 KPI Trend Page – Monthly and yearly trends for any selected KPI
📌 KPI Definition Page – Every KPI’s formula, meaning, and type (UTB/LTB)
You also get a structured Excel data model with:
✔ Input_Actual Sheet – Enter monthly MTD & YTD values
✔ Input_Target Sheet – Store all targets for comparison
✔ KPI Definition Sheet – Maintain formulas, units, groups & KPI types
Everything is designed for ease of use and full automation.
How to Use the Museums & Cultural Centres KPI Dashboard in Power BI 🛠️
Using the dashboard is simple—even for beginners:
1️⃣ Open the Excel data file
2️⃣ Enter actual performance numbers for each KPI
3️⃣ Update target values as needed
4️⃣ Refresh the Power BI dashboard
5️⃣ Use slicers to view any month or KPI group
6️⃣ Drill through to view KPI definitions when required
Within seconds, you get accurate and professional insights that support decision-making, reporting, and strategic planning. ⚡
Who Can Benefit from This Museums & Cultural Centres KPI Dashboard? 👥
This dashboard is designed for all cultural and museum-based teams:
🎯 Museum Directors – Track overall institutional performance
📊 Program Managers – Monitor cultural program outcomes
🎨 Exhibit Curators – Analyze visitor engagement and exhibit success
📈 Finance Teams – Compare actuals vs targets for better budgeting
👩🏫 Education & Outreach Teams – Measure program reach and impact
📑 Board Members & Donors – Understand organizational achievements quickly
If your museum wants stronger insights, better reporting, and improved impact measurement—this dashboard is the perfect solution.


Reviews
There are no reviews yet.