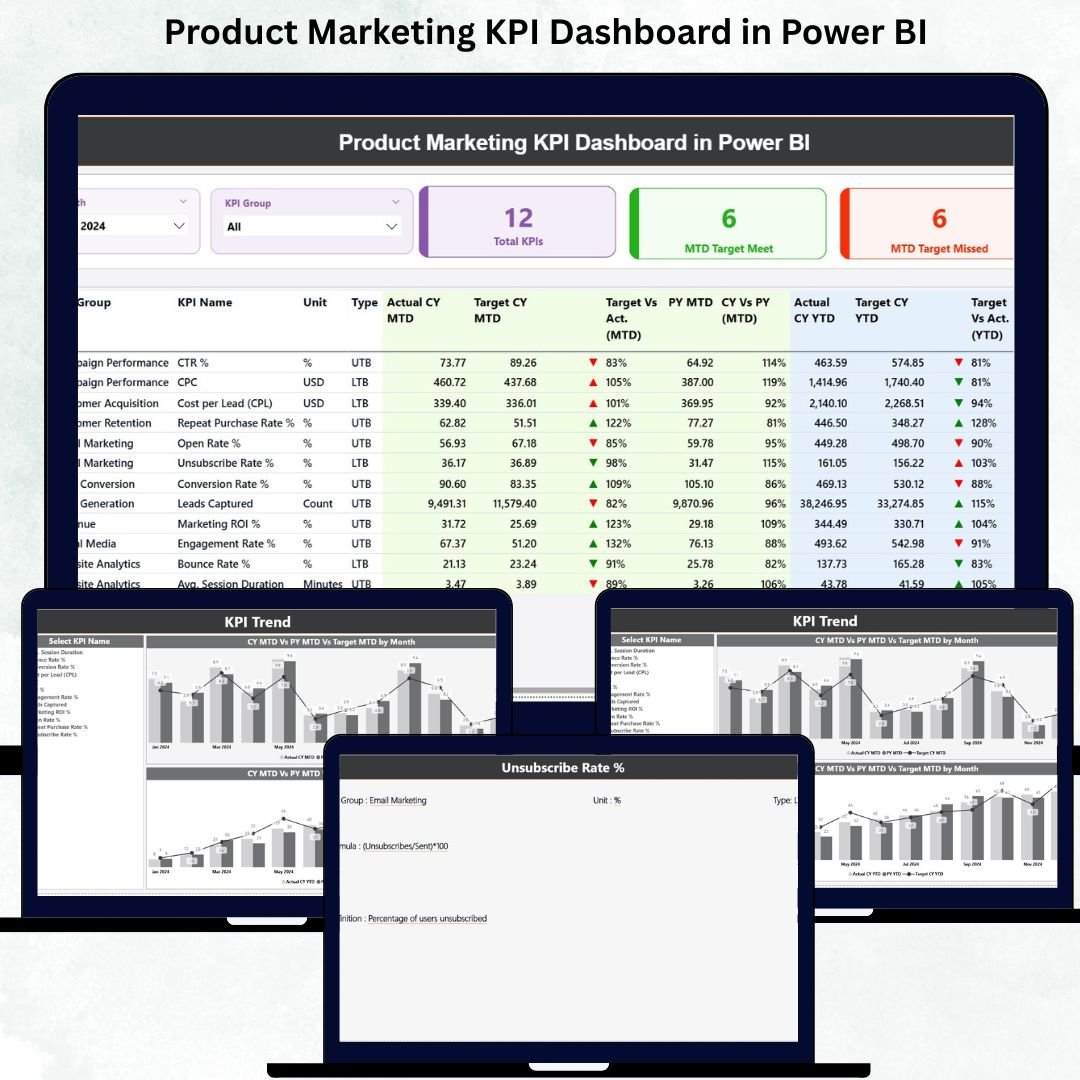
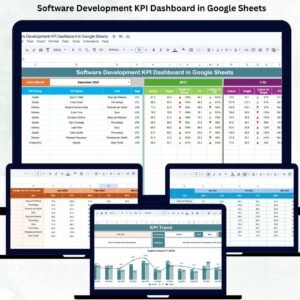
Product marketing is the engine that drives product growth. But without accurate KPIs, teams end up guessing, delaying decisions, and missing opportunities. Tracking performance using multiple spreadsheets becomes slow, confusing, and error prone. That’s why businesses now rely on the Product Marketing KPI Dashboard in Power BI—a powerful, interactive solution that brings all marketing KPIs into one clean, modern dashboard.
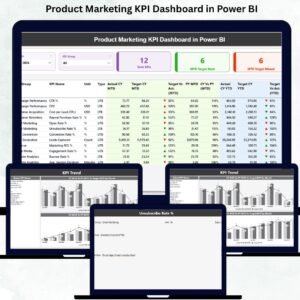
Product Marketing KPI Dashboard in Power BI This ready-to-use Power BI dashboard transforms raw Excel data into meaningful insights. It displays actual performance, targets, MTD and YTD values, visual comparisons, and previous year trends—all updated automatically. Product Marketing KPI Dashboard in Power BI Whether you’re tracking product awareness, conversions, campaign success, retention, or revenue KPIs, Product Marketing KPI Dashboard in Power BI this dashboard gives instant clarity, so teams take action without delay.
Built for product marketers, managers, analysts, and growth-focused teams, this dashboard removes the need for manual reporting and enables fast, data-driven decision-making.
✨ Key Features of the Product Marketing KPI Dashboard in Power BI
This dashboard includes three powerful pages, each designed to simplify KPI tracking and improve visibility across the entire marketing lifecycle.
📌 Summary Page – The Main Control Centre
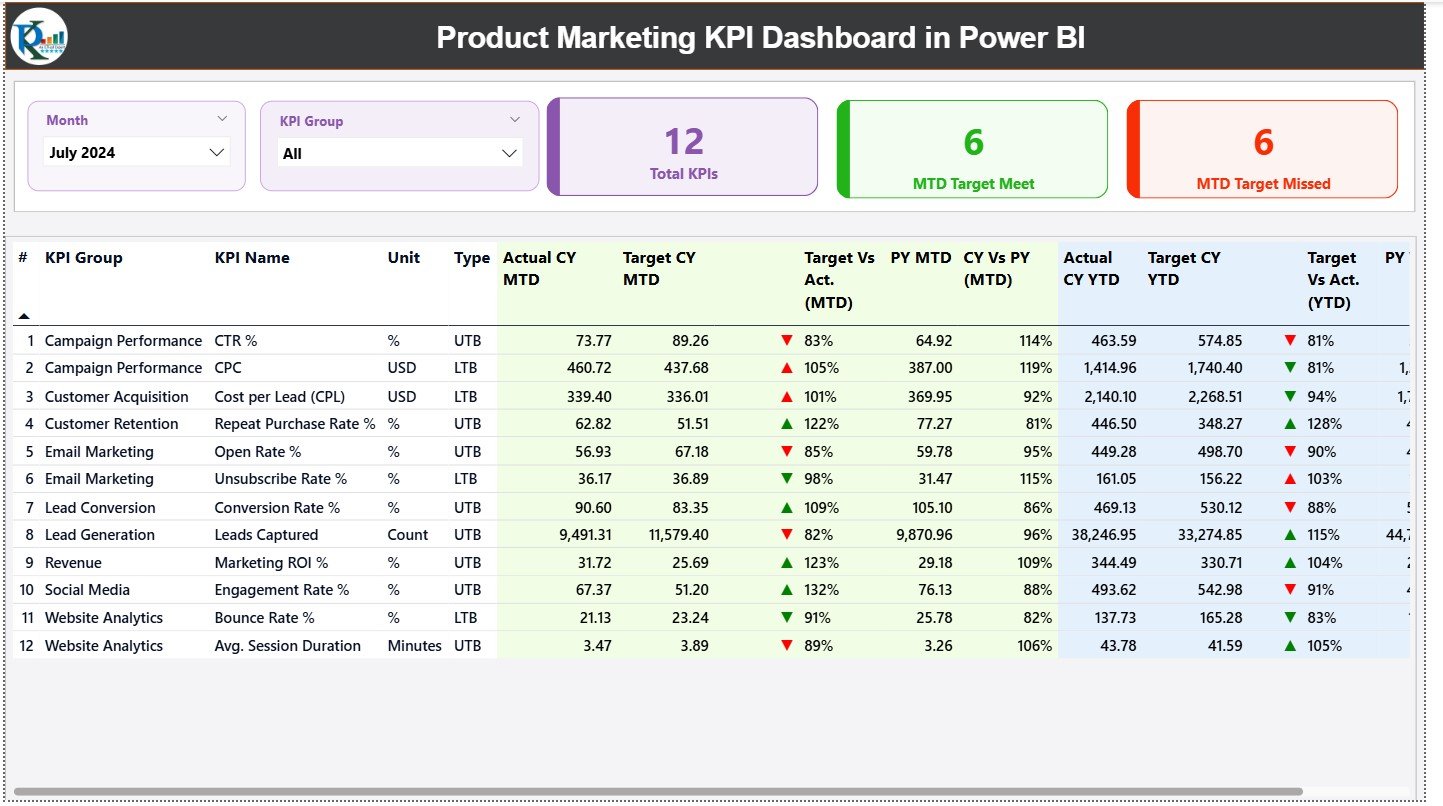
The Summary Page gives you a complete snapshot of KPI performance.
🔹 Smart KPI Slicers
At the top, you can filter by:
✔ Month
✔ KPI Group
This allows instant switching between different performance views.
🔹 KPI Cards for Quick Status
You get three high-level cards:
✔ Total KPIs Count
✔ MTD Target Meet Count
✔ MTD Target Missed Count
These help users check overall performance in seconds.
🔹 Detailed KPI Table (Full Transparency in One View)
The table reveals all KPI details including:
-
KPI Number
-
KPI Group
-
KPI Name
-
Unit
-
Type (UTB / LTB)
-
Actual CY MTD
-
Target CY MTD
-
MTD Icons (▲ or ▼)
-
Target vs Actual (%)
-
PY MTD
-
CY vs PY MTD
-
Actual CY YTD
-
Target CY YTD
-
YTD Icons
-
Target vs Actual (%)
-
PY YTD
-
CY vs PY YTD
This structured layout helps teams track real-time performance without opening multiple files or dashboards.
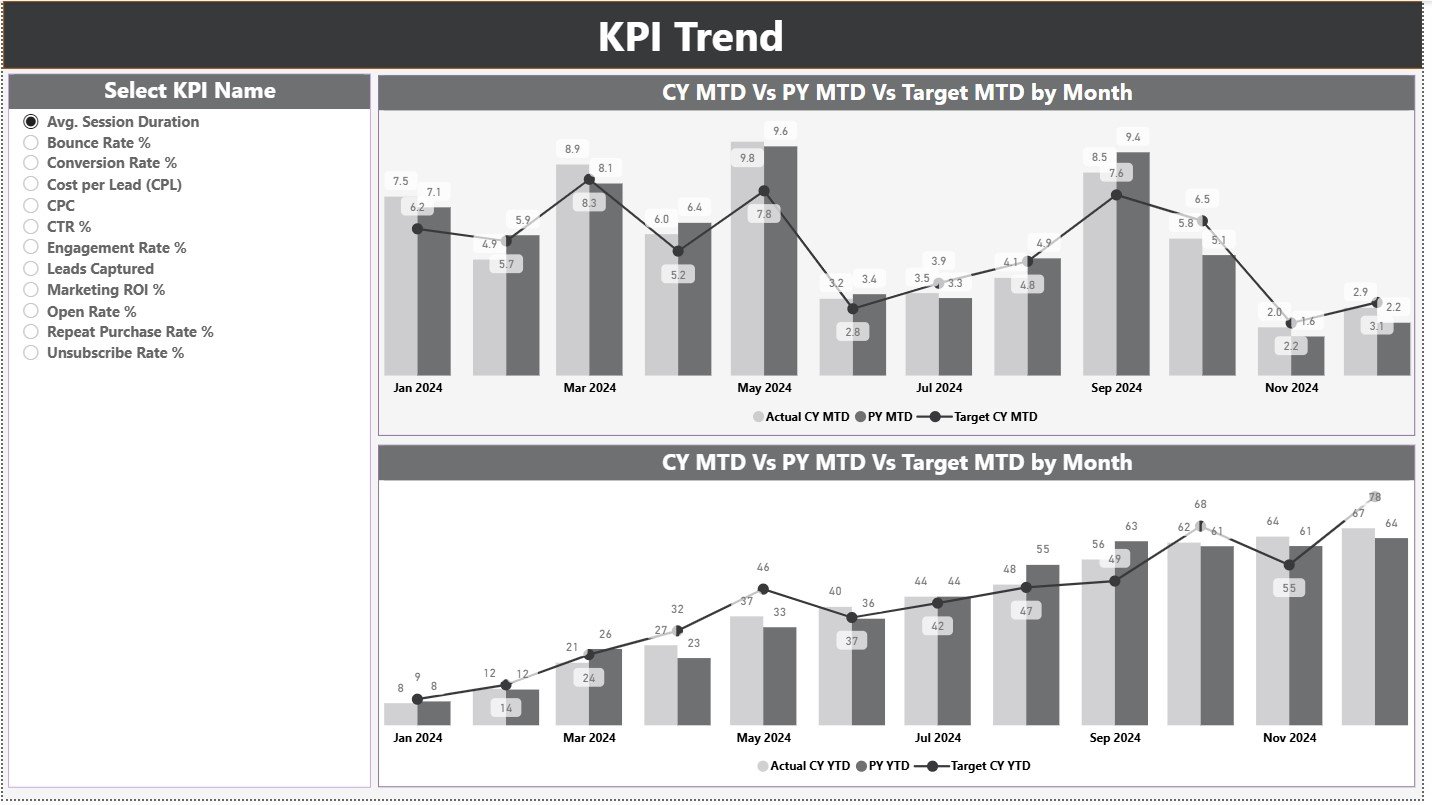
📌 KPI Trend Page – Track Monthly & Yearly Trends Easily
The KPI Trend Page provides clear visual storytelling with two trend charts:
📈 MTD Trend Chart
Shows:
✔ Current Year MTD Actual
✔ PY MTD
✔ Monthly Target
📊 YTD Trend Chart
Shows:
✔ Current Year YTD Actual
✔ PY YTD
✔ YTD Target
You can select any KPI using the slicer on the left side to view its complete performance pattern. This page helps teams identify growth opportunities, emerging issues, and seasonal changes.
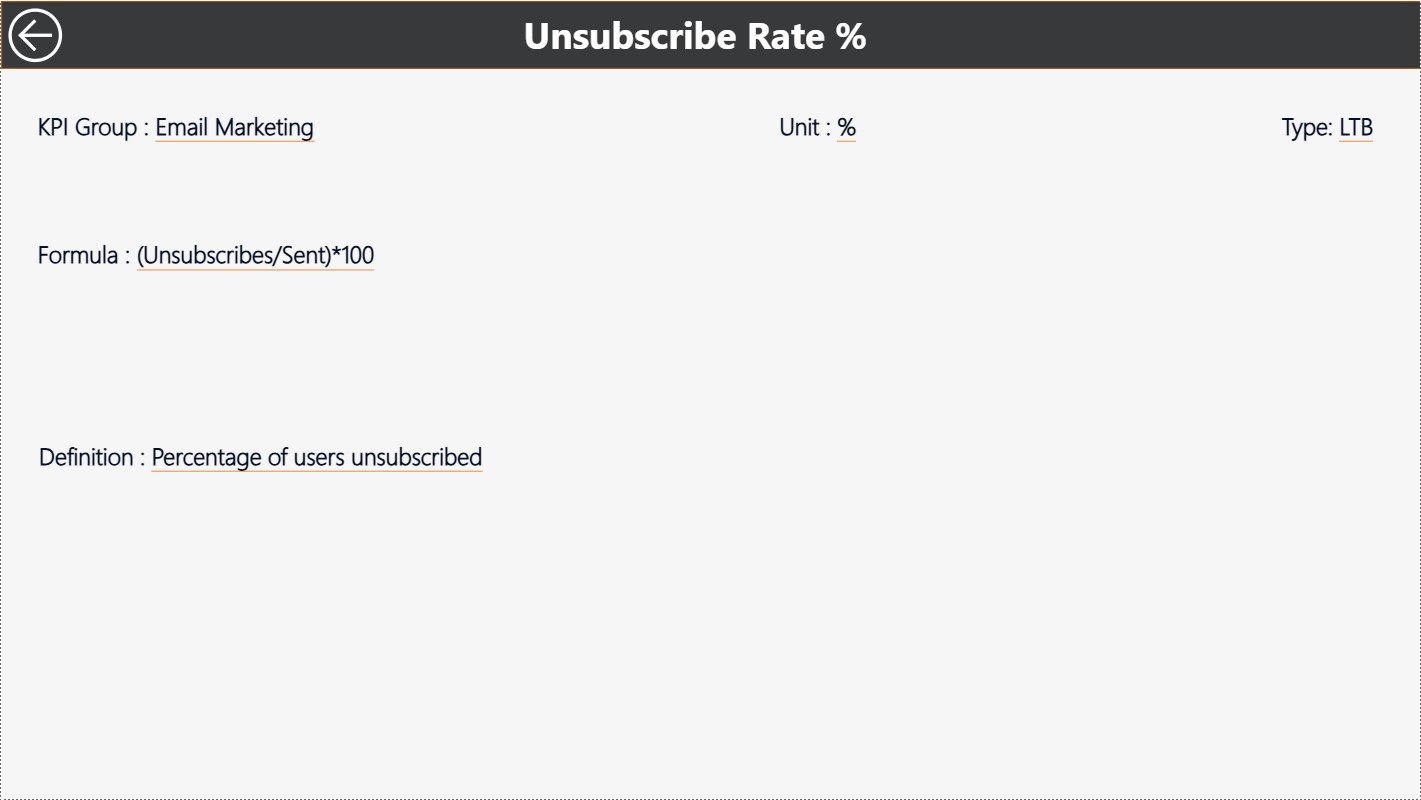
📌 KPI Definition Page – Understand KPI Details with Drill-Through
This is a hidden drill-through page accessible from the Summary Page.
It includes:
✔ KPI Number
✔ KPI Group
✔ KPI Name
✔ Unit
✔ Formula
✔ KPI Definition
✔ KPI Type (LTB or UTB)
This helps teams understand exactly how each KPI is calculated. A Back button takes you directly to the Summary Page.
📦 How the Dashboard Works (Excel-Powered & Fully Automated)
The dashboard connects to a structured Excel file containing:
1️⃣ Input_Actual Sheet
– KPI Name
– Month
– MTD Actual
– YTD Actual
2️⃣ Input_Target Sheet
– KPI Name
– Month
– MTD Target
– YTD Target
3️⃣ KPI Definition Sheet
– KPI Number
– Group
– Unit
– Formula
– Definition
– KPI Type
Once this data is updated, the dashboard refreshes automatically.
🎯 Advantages of the Product Marketing KPI Dashboard
1. Real-Time Insights
Instant updates help teams take immediate action.
2. Faster Decision-Making
Managers know exactly which KPIs are on track or falling behind.
3. Clear Trend Understanding
MTD/YTD patterns reveal long-term performance behavior.
4. Year-over-Year Comparison
PY values show whether performance is improving.
5. Zero Manual Reporting
Automated visuals save hours of work every month.
6. Accurate & Error-Free
Built-in formulas ensure calculation accuracy.
7. Easy to Maintain
Just update the Excel file—Power BI handles the rest.
🎓 Who Should Use This Dashboard?
This dashboard is designed for:
✔ Product Marketing Teams
✔ Growth Managers
✔ Product Managers
✔ Marketing Analysts
✔ Leadership Teams
✔ SaaS & Tech Companies
Any business that tracks product performance can benefit from this tool.


Reviews
There are no reviews yet.