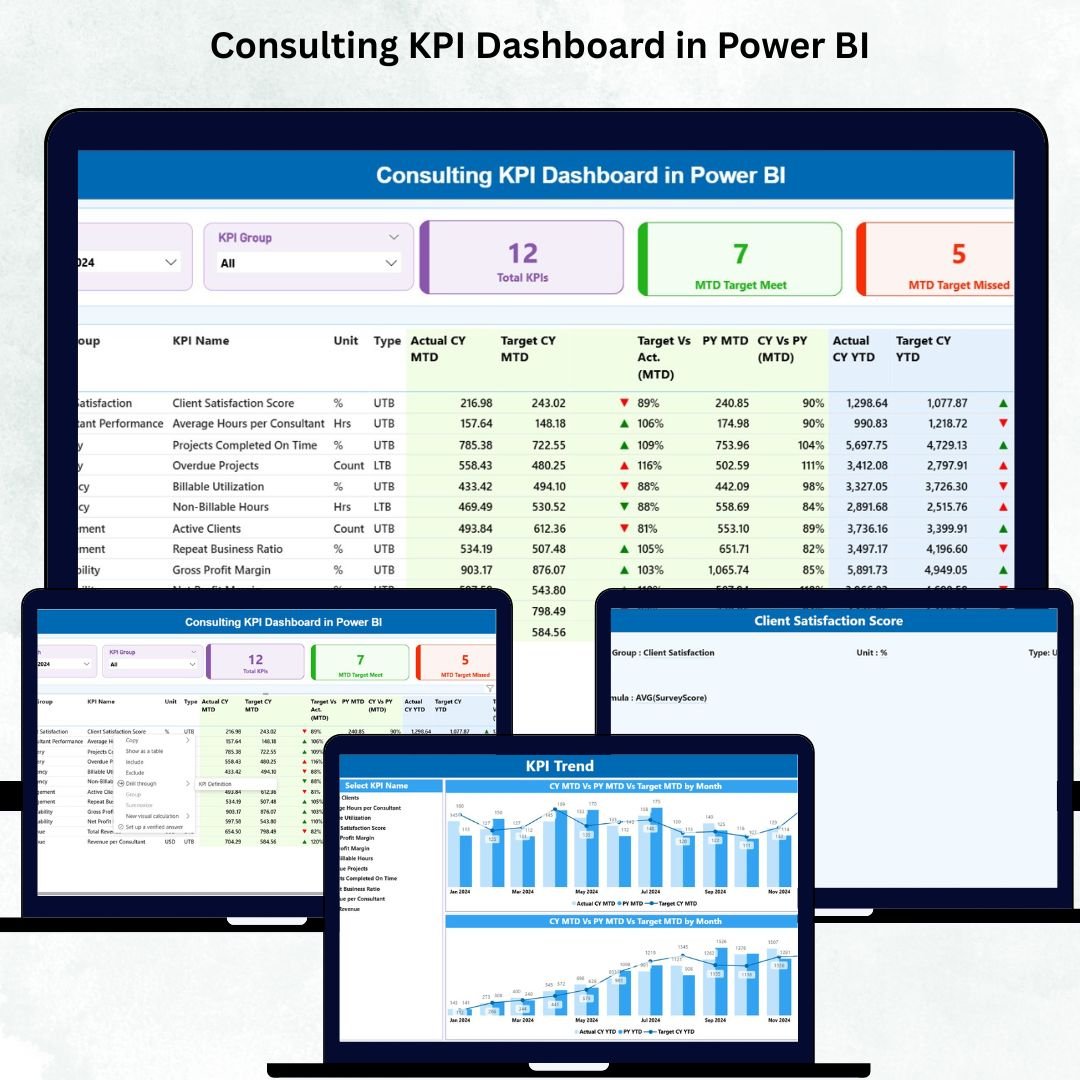
The Consulting KPI Dashboard in Power BI is a high-performance, ready-to-use reporting solution designed for consulting firms that want crystal-clear visibility into their KPIs, targets, performance trends, and operational efficiency. Whether you manage strategy, finance, operations, HR, or a full consulting portfolio, this dashboard gives you the power to monitor progress month-by-month and make smarter, faster decisions that drive business growth.
Built on an Excel backend, it offers full flexibility, effortless updates, and enterprise-grade analytics—without requiring advanced technical knowledge. If you want reliable KPI tracking, improved service delivery, and a structured performance monitoring system, this dashboard is exactly what your consulting team needs.
✨ Key Features of the Consulting KPI Dashboard in Power BI
🔹 Unified Performance View
Track all KPIs in one place and instantly view MTD, YTD, CY vs PY trends, target achievements, and performance insights.
🔹 Smart Filters & Slicers
Use the Month and KPI Group slicers to drill into specific categories like Productivity, Delivery, Operations, Finance, or Client Satisfaction.
🔹 Automated Insights
Visual indicators (🔼 green for target met, 🔽 red for target missed) simplify decision-making and highlight where attention is required.
🔹 Detailed KPI Table
View KPI Name, Group, Unit, Type (LTB/UTB), Actual MTD, Target MTD, PY MTD, CY vs PY, Actual YTD, Target YTD, and more.
🔹 Trend Analytics
The KPI Trend Page shows historical patterns, helping you identify performance growth, seasonality, and improvement areas.
🔹 Easy Excel-Based Data Source
Update data using simple Excel sheets—no coding, no complexity.
📦 What’s Inside the Consulting KPI Dashboard in Power BI
Inside the dashboard, you get three structured reporting pages, each designed with consulting workflows in mind:
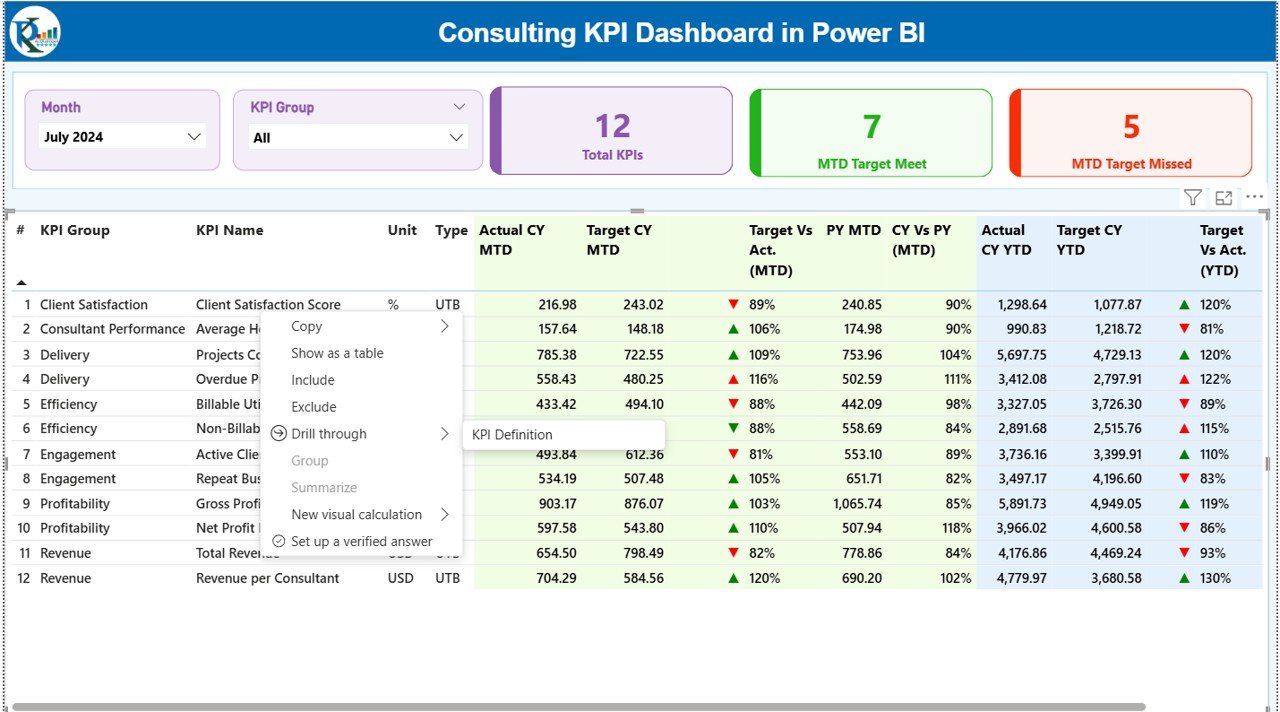
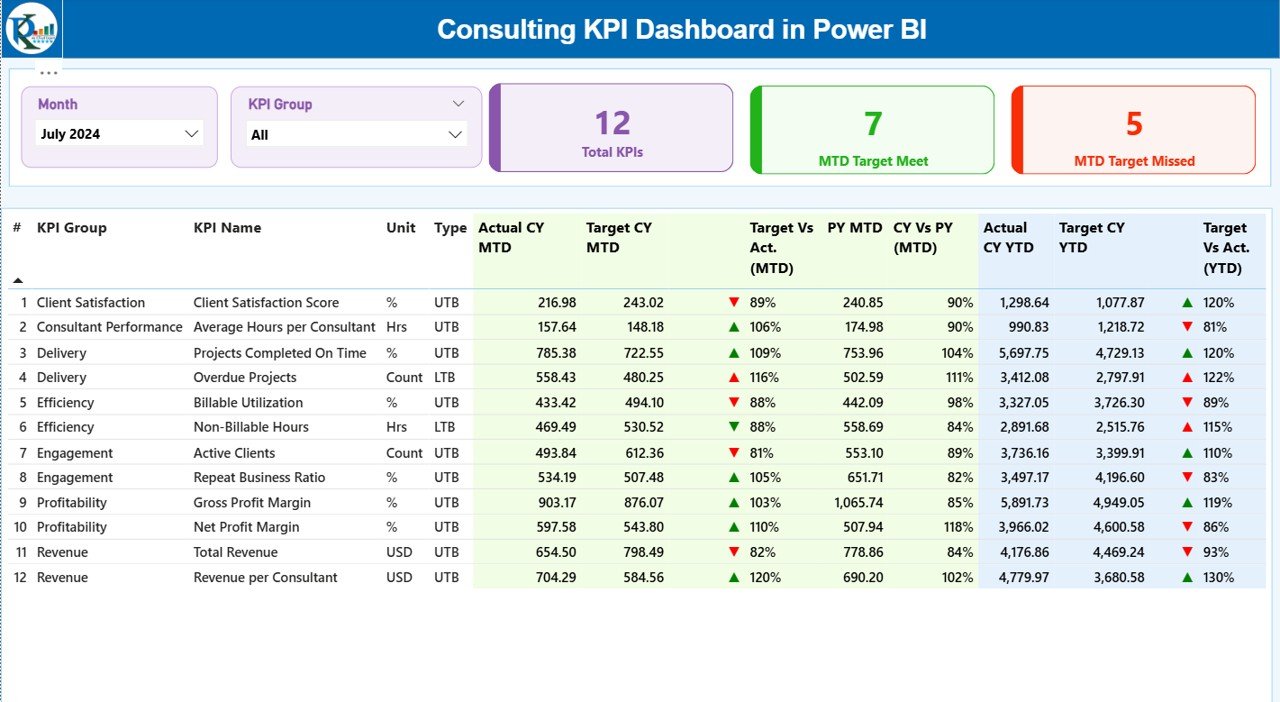
📍 1. Summary Page
A complete 360° performance snapshot with:
-
Month & KPI Group slicers
-
Total KPI count
-
MTD Target Met & Missed counts
-
Detailed KPI performance table
-
Visual achievement indicators
-
CY vs PY comparison
-
MTD & YTD analysis
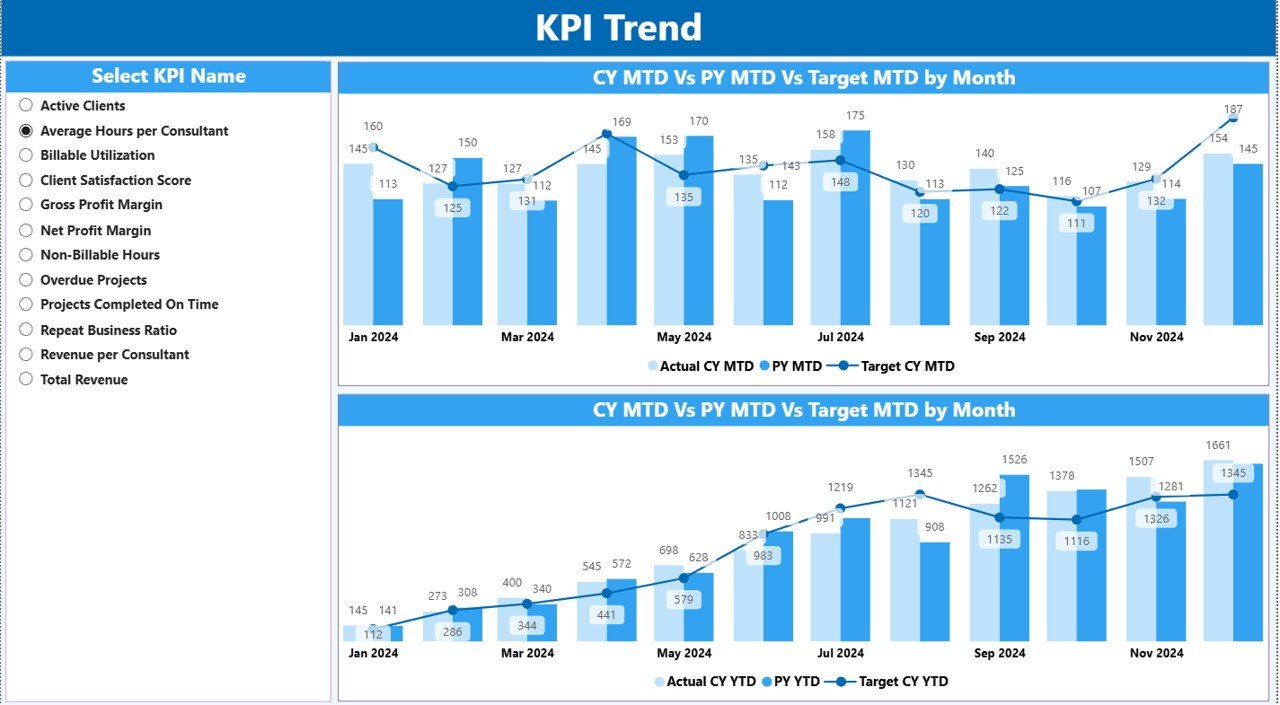
📍 2. KPI Trend Page
Two interactive charts that show:
-
CY actuals
-
PY actuals
-
Monthly targets
-
MTD trends
-
YTD trends
Plus a KPI slicer for deep analysis.
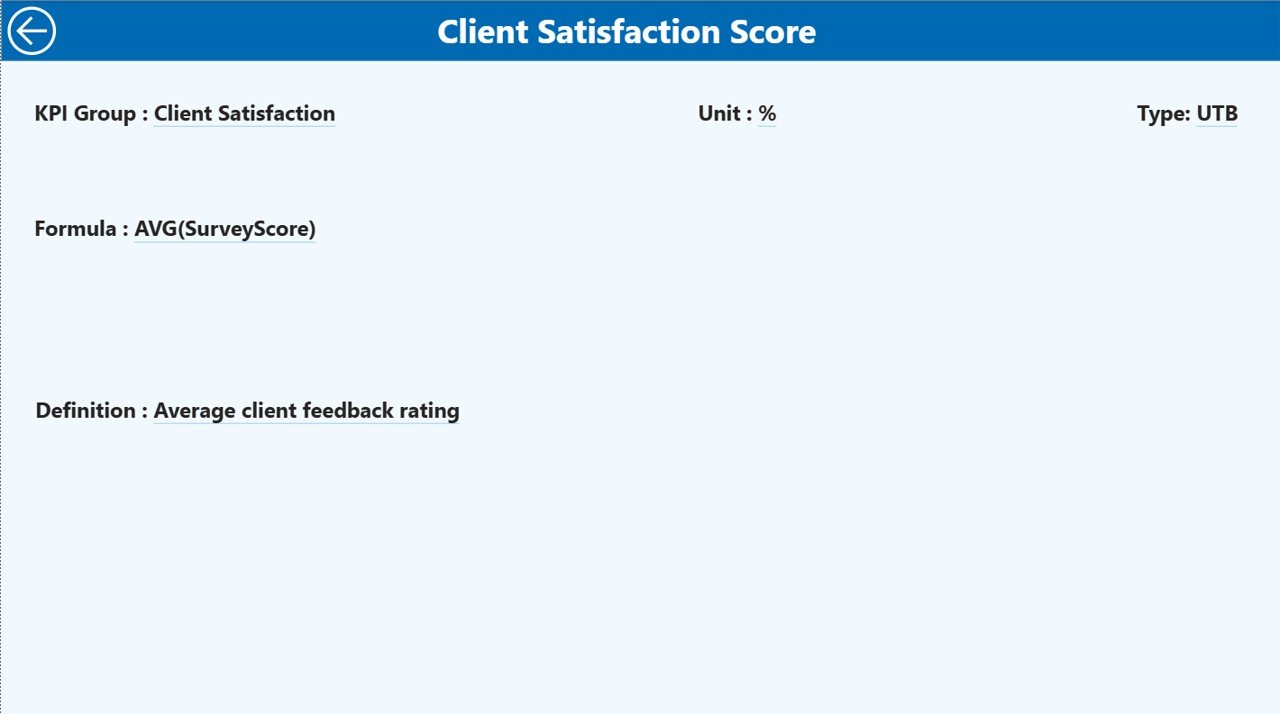
📍 3. KPI Definition Page
Understand every KPI with details like:
-
KPI Name
-
Group
-
Unit
-
Formula
-
Definition
-
Type (UTB / LTB)
📁 Excel Data Source (Included)
-
Input_Actual
-
Input_Target
-
KPI Definition
This makes the dashboard 100% editable, scalable, and easy to maintain.
🛠️ How to Use the Consulting KPI Dashboard in Power BI
Using the dashboard is extremely simple—no technical background required.
✔️ Step 1: Enter Data in Excel
Update MTD and YTD values in the Actual and Target sheets.
✔️ Step 2: Refresh Power BI
Hit the Refresh button in Power BI to update visuals instantly.
✔️ Step 3: Analyze KPIs
Use slicers, MTD/YTD icons, and charts to analyze performance.
✔️ Step 4: Drill Into Details
Right-click any KPI to open the detailed KPI Definition Page.
✔️ Step 5: Review Trends Monthly
Use the KPI Trend page to monitor growth and forecast results.
🎯 Who Can Benefit from This Consulting KPI Dashboard in Power BI
This dashboard is perfect for:
👨💼 Consulting Firms
Track financials, delivery performance, productivity, and client metrics.
🧑💻 IT & Technology Consultants
Monitor project efficiency, resource utilization, and service quality.
🏢 Strategy & Business Advisors
Analyze trends, targets, and year-over-year improvements.
🧮 Finance & Operations Consultants
Get complete clarity on performance and operational KPIs.
👤 Independent Consultants
Show clients professional-grade reporting and insights.
🧑🏫 Professional Service Providers
Strengthen reporting, improve visibility, and deliver better outcomes.
### Click here to read the detailed blog post
Watch the step-by-step video tutorial:


Reviews
There are no reviews yet.