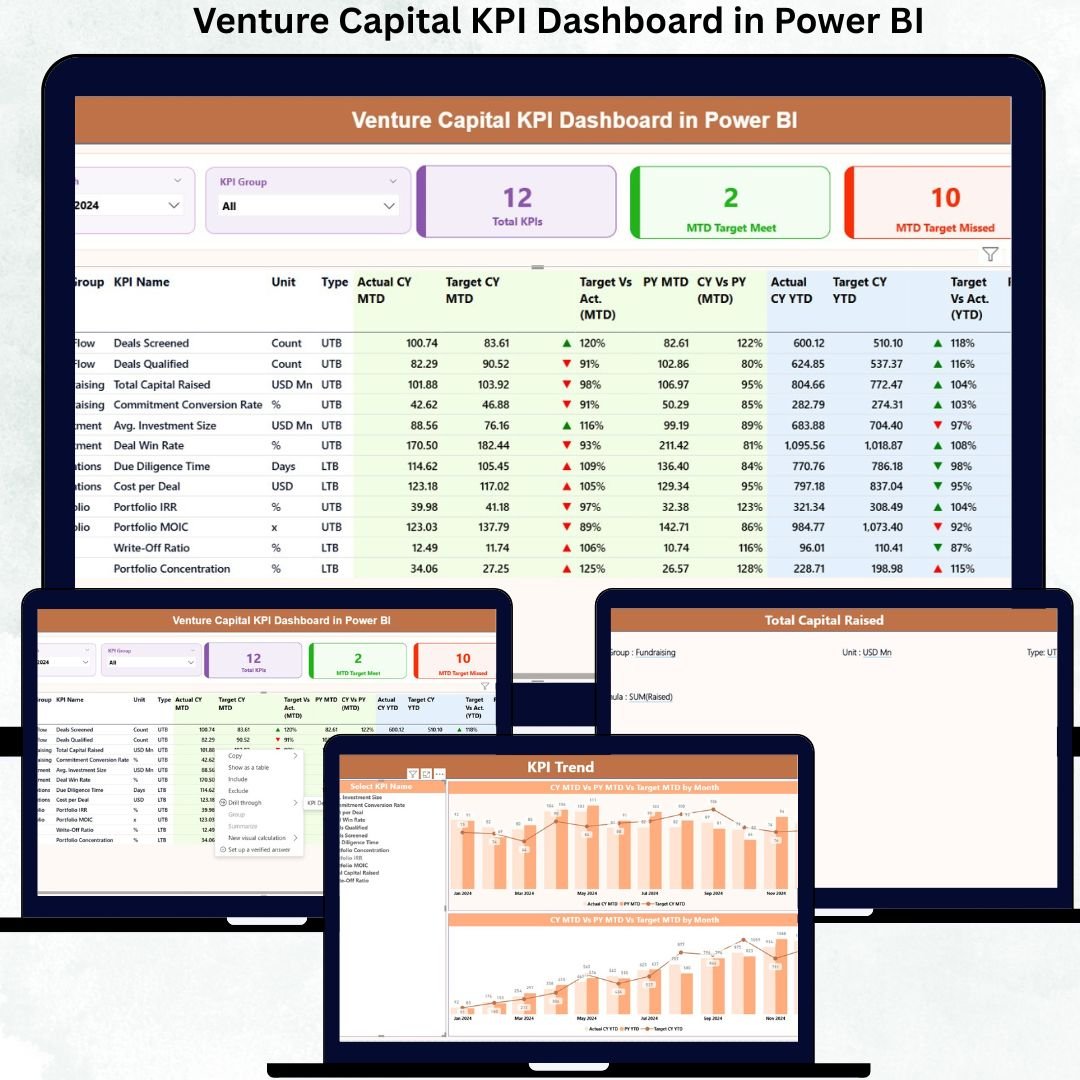
Venture capital firms work in a high-pressure world where timing, clarity, and accurate performance tracking decide success or failure. Every delay, missed target, or unclear metric can impact portfolio health and investor confidence. That is exactly why the Venture Capital KPI Dashboard in Power BI is built—to give you instant, data-driven clarity in one powerful analytical cockpit.
Instead of juggling multiple Excel files, manual charts, and delayed review meetings, this ready-to-use dashboard converts your raw Excel data into clean, interactive, executive-ready Power BI insights. With just a few clicks, partners, analysts, and fund managers gain full control over MTD, YTD, target tracking, and year-over-year performance.
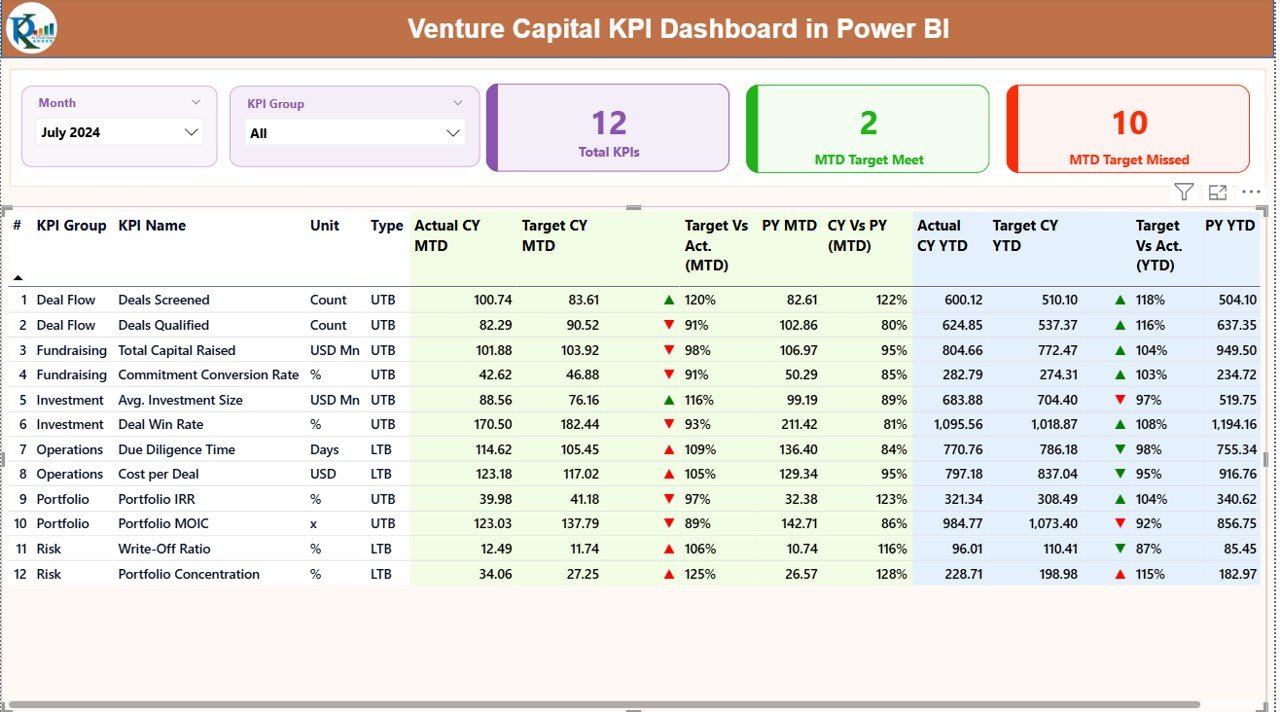
✅ Key Features of Venture Capital KPI Dashboard in Power BI
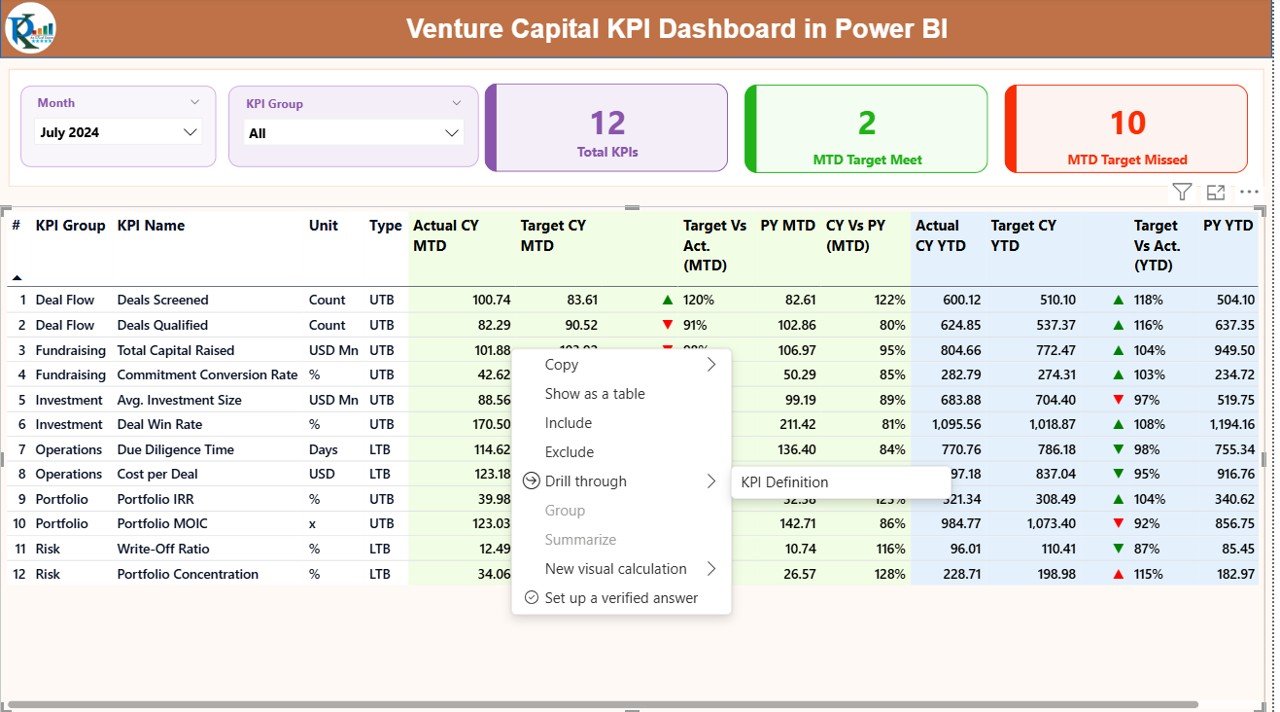
📊 Executive-Level Summary View
Get a high-level snapshot of all venture capital KPIs in one place without digging through data.
📅 Dynamic Month & KPI Group Slicers
Filter performance by month or KPI category instantly for faster analysis.
🎯 MTD & YTD Performance Tracking
Monitor Month-to-Date and Year-to-Date results side by side for complete visibility.
📈 Target vs Actual Comparison with Status Icons
Identify underperforming KPIs instantly using visual green and red indicators.
📉 Current Year vs Previous Year Analysis
Evaluate growth trends and performance improvements over time.
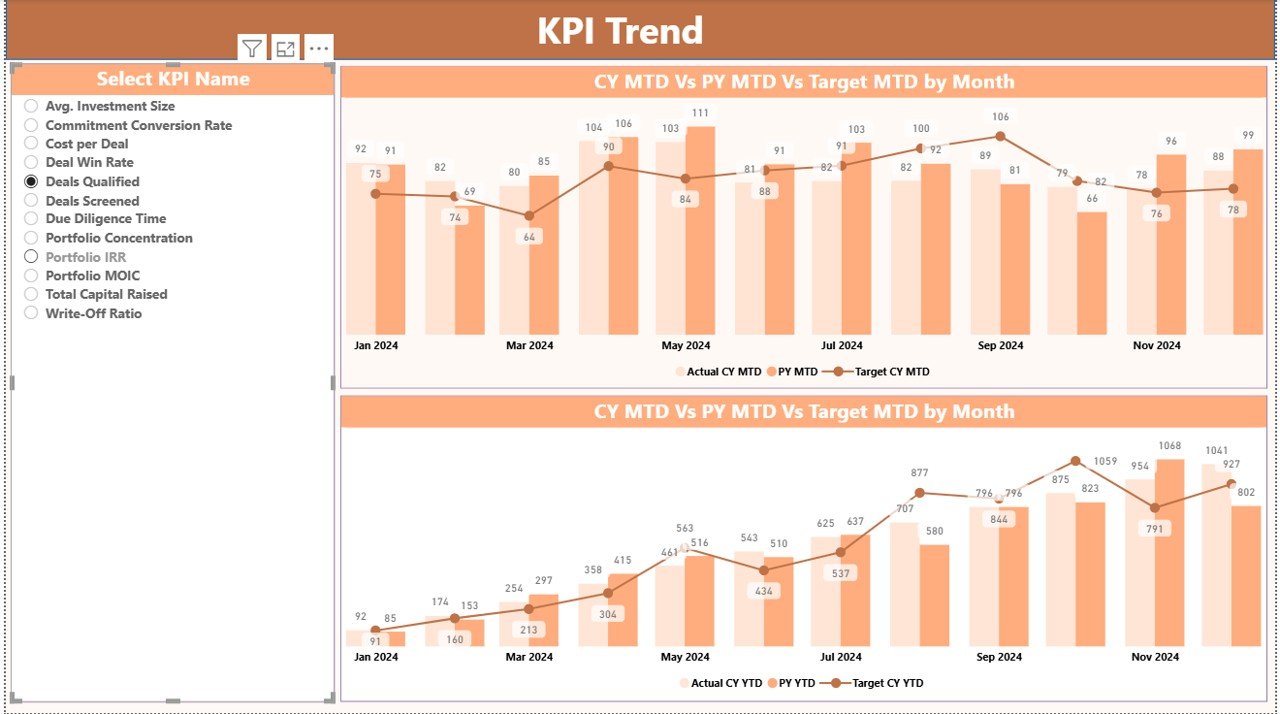
🔍 KPI Trend Analysis Page
Analyze historical MTD and YTD trends using clean combo charts.
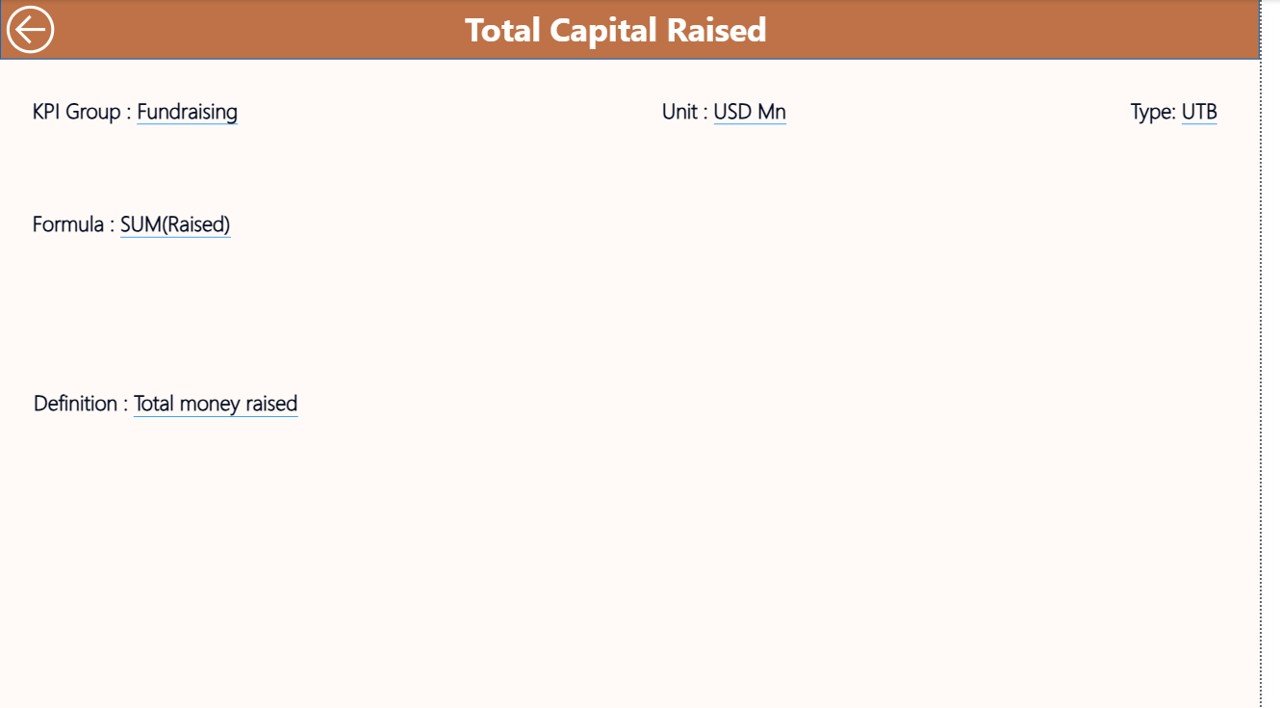
📘 Drill-Through KPI Definition Page
Click any KPI and view its definition, formula, unit, and performance logic instantly.
📂 Excel-Based Data Input
Update performance, targets, and definitions easily without Power BI expertise.
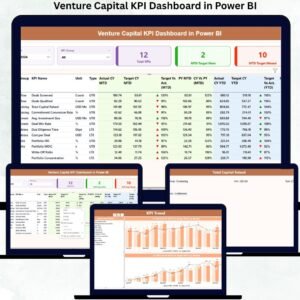
📦 What’s Inside the Venture Capital KPI Dashboard in Power BI
This digital product includes a fully designed Power BI Desktop file connected to a structured Excel data model.
You get:
✅ 3 Interactive Power BI Pages
-
Summary Page for portfolio-level insights
-
KPI Trend Page for deep historical analysis
-
KPI Definition Page for transparency and clarity
✅ Pre-Built KPI Tables & Calculations
-
MTD Actual vs Target
-
YTD Actual vs Target
-
CY vs PY comparisons
-
Automated performance indicators
✅ User-Friendly Navigation
-
Slicers
-
Drill-through buttons
-
Back navigation for smooth analysis flow
Everything is optimized to be production-ready for real venture capital use cases.
🛠️ How to Use the Venture Capital KPI Dashboard in Power BI
Using this dashboard is simple—even if you are not a Power BI expert.
1️⃣ Enter actual KPI values in the Input_Actual Excel sheet
2️⃣ Update monthly targets in the Input_Target sheet
3️⃣ Define or modify KPIs in the KPI Definition sheet
4️⃣ Refresh the Power BI dashboard
5️⃣ Instantly analyze performance, trends, and gaps
Because calculations are automated, your team focuses on insights—not formulas.
👥 Who Can Benefit from This Venture Capital KPI Dashboard in Power BI
This dashboard is designed for both strategic and operational roles:
✅ Venture Capital Partners
✅ Investment Analysts
✅ Fund Managers
✅ Portfolio Managers
✅ Finance & Strategy Teams
✅ VC Firms of all sizes
Whether you manage a single fund or multiple portfolios, this dashboard scales with your needs.
🔗 Click here to read the Detailed blog post
Watch the step-by-step video tutorial:


Reviews
There are no reviews yet.