Subscription Box Services Dashboard in Excel businesses thrive on recurring revenue, loyal customers, and efficient operations. Whether you run a beauty box, food box, fashion box, wellness box, or lifestyle subscription service, tracking performance accurately is critical. However, many subscription teams still rely on scattered spreadsheets, manual calculations, and delayed monthly reviews. As a result, revenue leaks, rising costs, and customer dissatisfaction often go unnoticed. That is exactly why the Subscription Box Services Dashboard in Excel becomes a powerful and practical solution for subscription-based businesses.
This ready-to-use Excel dashboard transforms raw subscription data into a centralized, interactive, and visually clear performance management system. Instead of juggling multiple files, founders, managers, and analysts can track recurring revenue, operating costs, customer satisfaction, acquisition efficiency, and regional performance in one structured dashboard. Consequently, decision-making becomes faster, more accurate, and fully data-driven.
Because this dashboard works entirely within Microsoft Excel, it remains cost-effective and easy to adopt. You do not need expensive BI tools or technical expertise. Simply update the data in the backend sheet, and the dashboard refreshes automatically with updated insights.
🔑 Key Features of Subscription Box Services Dashboard in Excel
📦 Centralized Subscription Performance View – Track revenue, costs, satisfaction, and acquisition metrics in one Excel dashboard.
📊 Executive KPI Cards & Visuals – Instantly understand business health with high-impact KPI cards and charts.
🎛️ Interactive Right-Side Slicers – Filter insights by month, region, plan type, box type, or acquisition channel.
📈 Multi-Dimensional Analysis – Analyze performance across plans, box types, channels, regions, and time.
⚡ Automated Excel Reporting – Reduce manual reporting effort and minimize calculation errors.
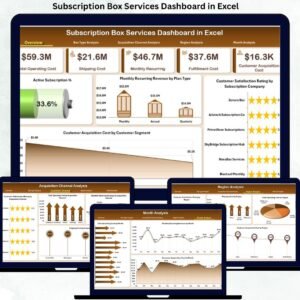
📂 What’s Inside the Subscription Box Services Dashboard in Excel
This professionally designed dashboard includes five structured analytical pages, supported by backend data sheets:
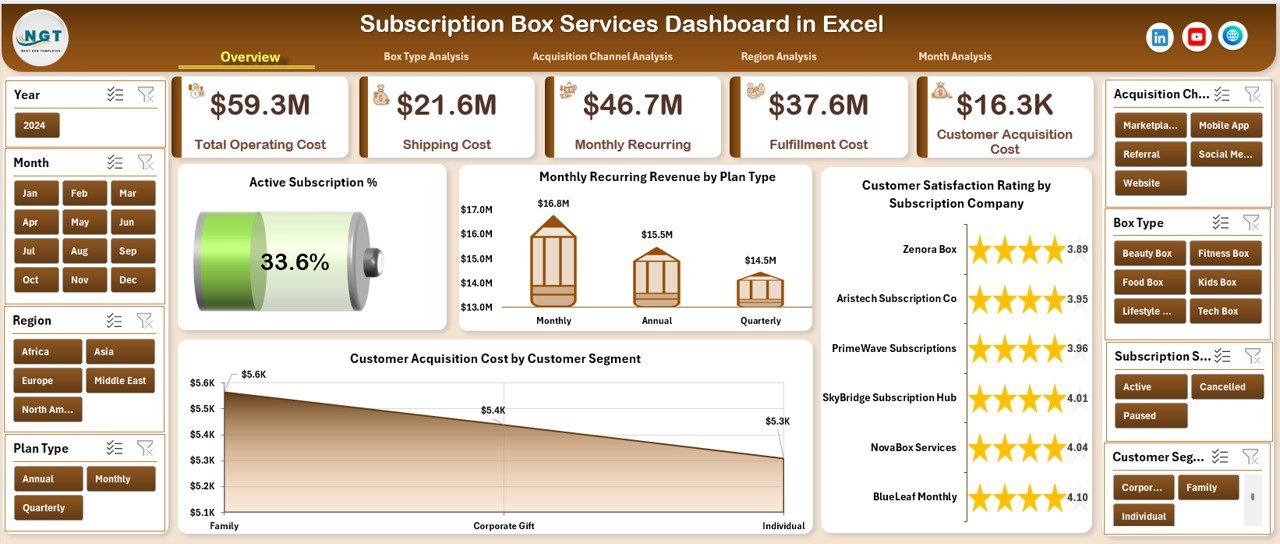
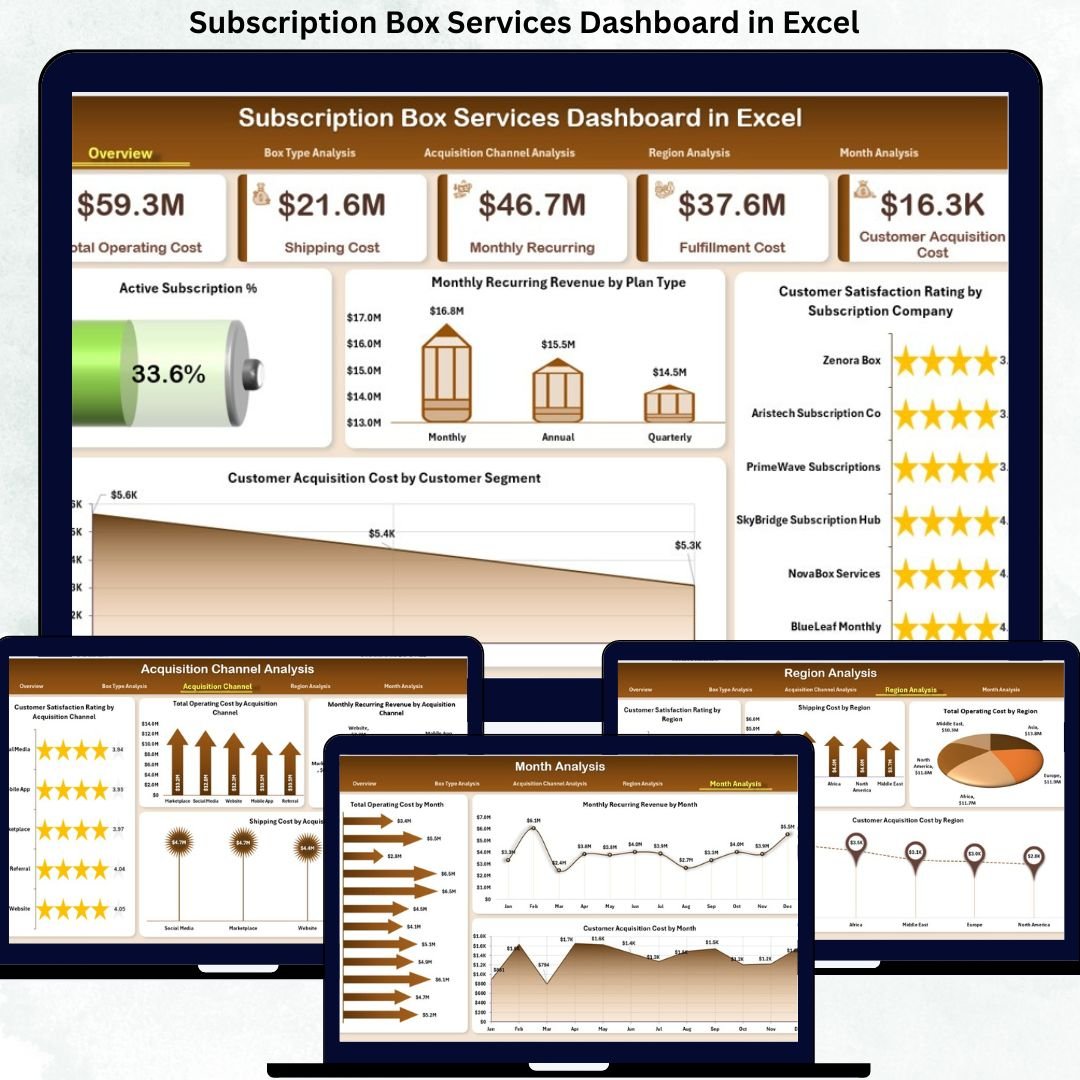
📊 Overview Page – A high-level snapshot with KPI cards and charts such as Active Subscription %, Monthly Recurring Revenue by Plan Type, Customer Satisfaction Rating by Subscription Company, and Customer Acquisition Cost by Customer Segment.
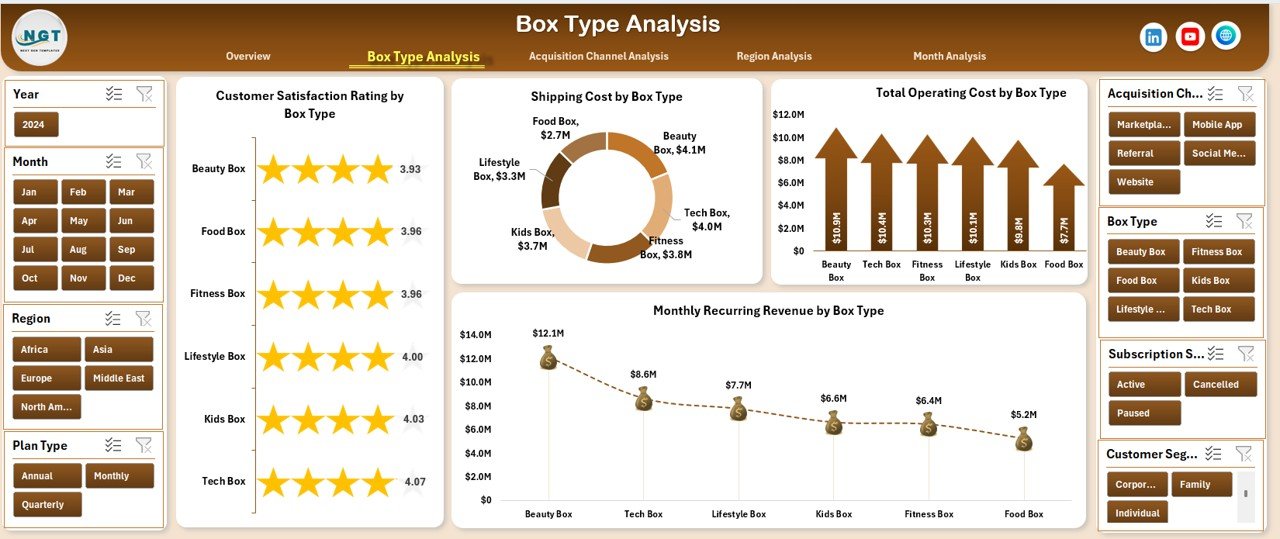
🎁 Box Type Analysis Page – Analyze Customer Satisfaction, Shipping Cost, Total Operating Cost, and Monthly Recurring Revenue by Box Type to balance delight and profitability.
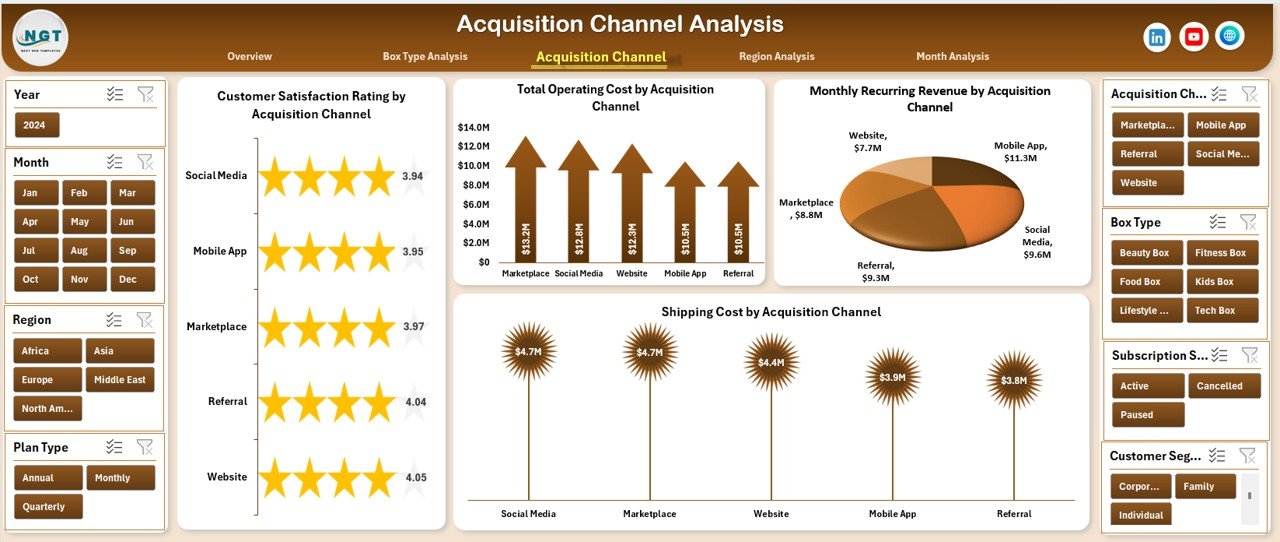
📢 Acquisition Channel Analysis Page – Evaluate Customer Satisfaction, Operating Cost, Monthly Recurring Revenue, and Shipping Cost by Acquisition Channel to optimize marketing spend.
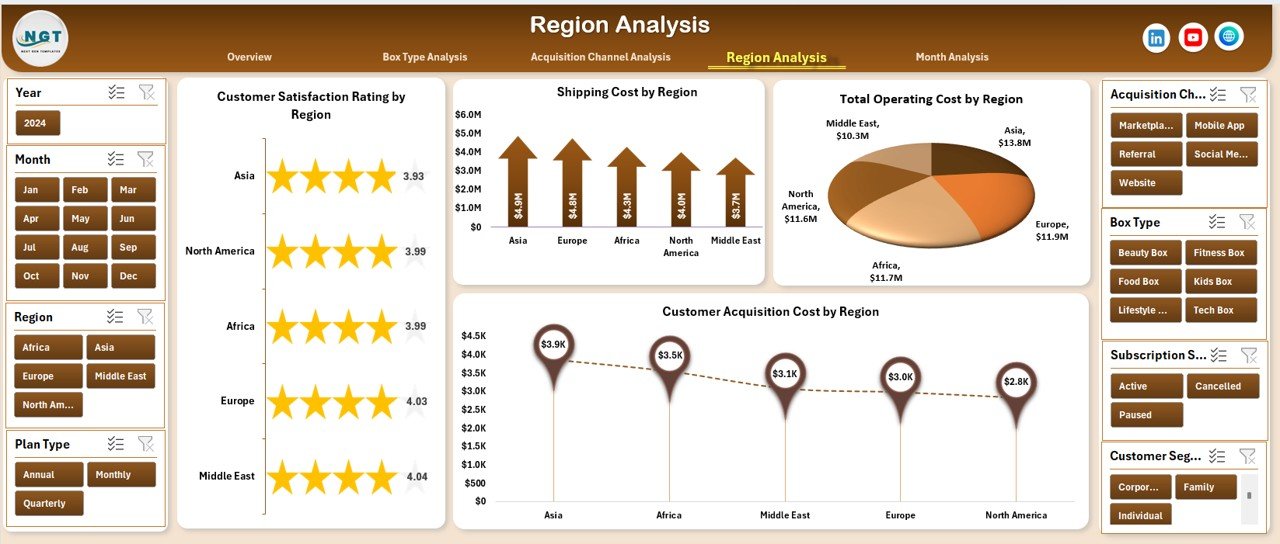
🌍 Region Analysis Page – Compare Customer Satisfaction, Shipping Cost, Operating Cost, and Acquisition Cost by Region to support expansion and cost control decisions.
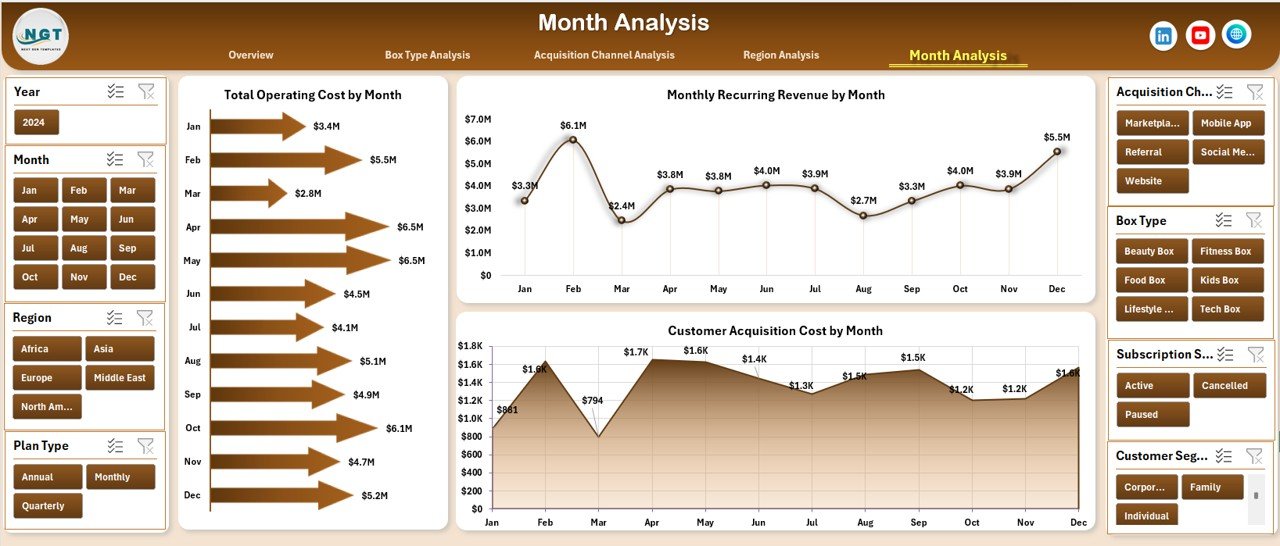
📅 Month Analysis Page – Track Total Operating Cost, Monthly Recurring Revenue, and Customer Acquisition Cost by Month to identify trends and seasonality.
📄 Data Sheet – Central location to enter or paste raw subscription business data.
🛠 Support Sheet – Helper calculations and lookup logic that power slicers and visuals.
Each page updates instantly when slicers are applied, enabling smooth navigation from overview insights to deep analysis.
▶️ How to Use the Subscription Box Services Dashboard in Excel
Using this dashboard is simple and business-friendly:
1️⃣ Enter or paste subscription data into the Data Sheet.
2️⃣ Let Excel process calculations automatically via the Support Sheet.
3️⃣ Navigate between pages using the page navigator.
4️⃣ Apply slicers to filter by plan type, box type, region, channel, or month.
5️⃣ Analyze KPIs and charts to take data-driven actions.
No advanced Excel skills are required—basic Excel knowledge is enough.
👥 Who Can Benefit from This Subscription Box Services Dashboard in Excel
This dashboard is ideal for:
📦 Subscription Box Founders & Owners
⚙️ Operations & Logistics Managers
📢 Marketing & Growth Teams
💰 Finance & Planning Teams
📊 Business Analysts & Strategists
Each stakeholder gains clarity, control, and confidence in decision-making.
### 👉 Click here to read the Detailed Blog Post
Visit our YouTube channel to learn step-by-step video tutorials.


Reviews
There are no reviews yet.