


Strategic Planning KPI Dashboard is the foundation of business success. Without a clear roadmap and measurable goals, even the best initiatives can lose focus. Organizations today rely heavily on Key Performance Indicators (KPIs) to measure progress, but simply defining them isn’t enough. Companies also need a structured, accessible, and interactive tool to track, visualize, and analyze KPIs.
That’s where the Strategic Planning KPI Dashboard in Excel comes in. Built with simplicity and effectiveness in mind, this ready-to-use dashboard empowers managers, executives, and teams to monitor both short-term and long-term performance—all in a single file. It turns raw data into actionable insights, helping businesses align decisions with strategy.
✨ Key Features of Strategic Planning KPI Dashboard in Excel
-
🏠 Home Sheet – A clean entry point with navigation buttons to all key tabs.
-
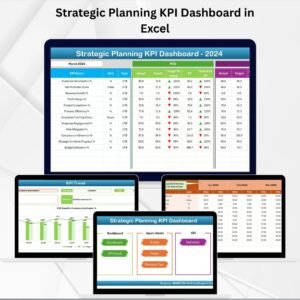
📊 Dashboard Page – Displays MTD (Month-to-Date) and YTD (Year-to-Date) Actual vs Target vs Previous Year. Includes up/down arrows for instant performance checks.
-
📈 KPI Trend Page – Drill into any KPI. Shows its group, unit, type (LTB/UTB), formula, and definition with trend charts.
-
📝 Actual Numbers Input Sheet – Enter monthly and yearly results to keep data current. Updates all visuals automatically.
-
🎯 Target Sheet – Store MTD and YTD goals for automated comparisons.
-
📂 Previous Year Numbers – Historical data storage for year-over-year analysis.
-
📖 KPI Definition Sheet – A reference library with KPI names, groups, formulas, and definitions to ensure consistency.
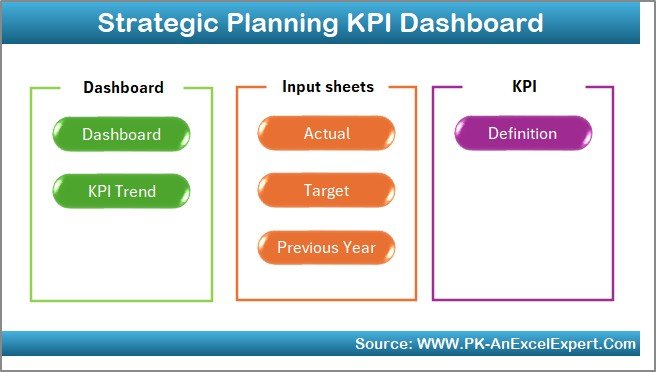
📦 What’s Inside the Dashboard
This Excel template is organized into seven structured tabs:
-
Home Sheet – 6 navigation buttons for seamless access.
-
Dashboard – Visual KPI monitoring with conditional formatting.
-
KPI Trend – Drill-down details for individual KPIs with charts.
-
Actual Numbers Input – Enter real performance values.
-
Target Sheet – Track planned vs actual goals.
-
Previous Year Numbers – Compare against historical benchmarks.
-
KPI Definition – Standardized reference for all KPIs.
This structure ensures every stakeholder—executive, manager, or analyst—gets a single source of truth.
🛠️ How to Use the Strategic Planning KPI Dashboard
-
Open the Home Sheet – Use navigation buttons to move quickly across tabs.
-
Input Data – Enter current performance in the Actual Numbers Input sheet.
-
Set Targets – Update monthly and yearly targets in the Target Sheet.
-
Compare & Analyze – Review the Dashboard for MTD/YTD vs targets and trends.
-
Drill Down – Use the KPI Trend page to study one metric in depth.
-
Review History – Compare with Previous Year data for growth insights.
-
Standardize KPIs – Use the Definition Sheet to align all teams.
With this process, the dashboard becomes a real-time decision-making tool.
👥 Who Can Benefit from This Dashboard
-
Executives & Leadership Teams – Monitor strategic goal alignment.
-
Finance Teams – Track performance against budgets and targets.
-
Operations Managers – Stay accountable with MTD and YTD insights.
-
SMBs & Startups – Access KPI tracking without costly BI tools.
-
Consultants & Analysts – Provide data-backed reports to stakeholders.
📖 Click here to read the Detailed blog post
🎥 Visit our YouTube channel to learn step-by-step video tutorials


Reviews
There are no reviews yet.