


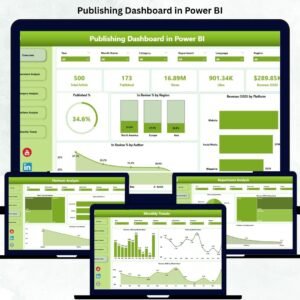
The Publishing Dashboard in Power BI is a powerful, interactive analytics solution designed to help publishers, media houses, and content creators track, visualize, and optimize performance across every aspect of their publishing workflow.
From author productivity and category performance to revenue growth and platform reach — this dashboard brings all key metrics into one central visual workspace, empowering leaders to make faster, data-driven decisions.
Built entirely in Microsoft Power BI, it connects directly with Excel or other data sources to transform raw data into actionable insights. Whether you manage digital articles, printed books, or multimedia publications, this dashboard helps you measure what matters — efficiency, engagement, and profitability.
✨ Key Features of the Publishing Dashboard in Power BI
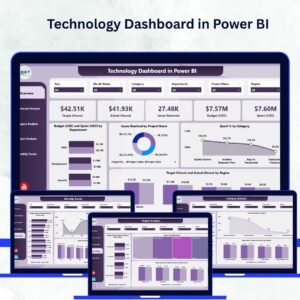
✅ 📊 Overview Page – The Central Insight Hub
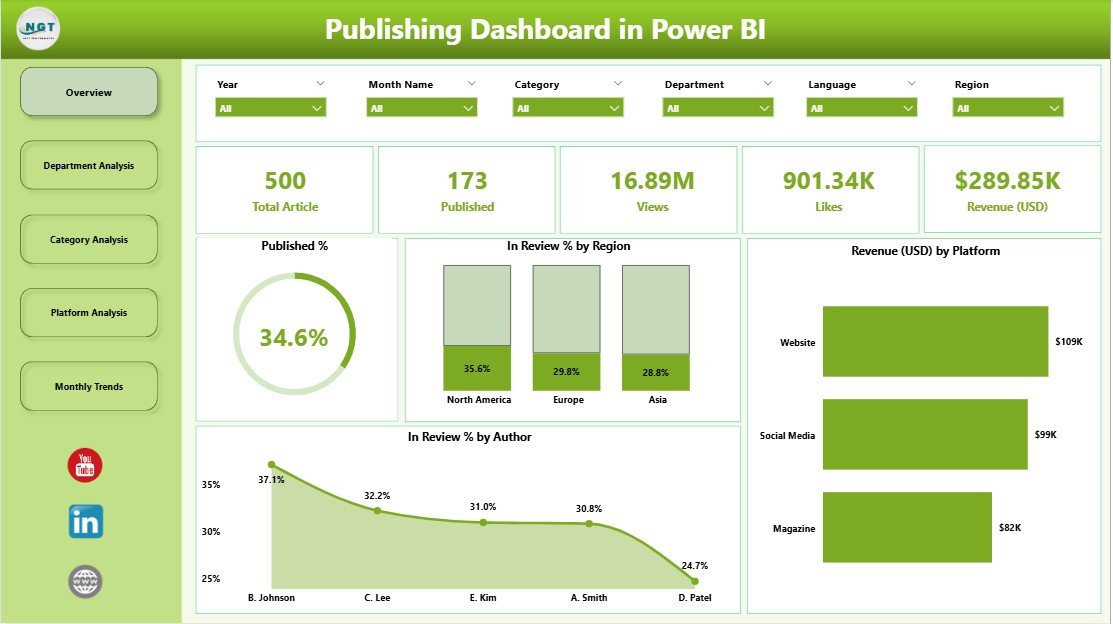
The Overview Page gives you a complete snapshot of publishing performance.
Includes:
-
5 KPI Cards: Total Publications, In-Review Items, Approved Content, Revenue Progress, and Published %.
-
Visual Charts: Published % and In-Review % by Region, Revenue (USD) by Platform, In-Review % by Author.
🎯 Quickly identify which regions, authors, or platforms are performing best and where to improve efficiency.
✅ 🏢 Department Analysis Page – Evaluate Team Performance
Analyze departmental contribution and productivity through:
-
Views by Department
-
Revenue (USD) by Department
-
Published % by Department
💼 Spot top-performing teams, streamline workflows, and ensure resources are aligned with publishing goals.
✅ 📚 Category Analysis Page – Measure Content Success
Track how each content category performs in terms of engagement and revenue.
Charts include:
-
Likes by Category ❤️
-
Revenue (USD) by Category 💰
-
Published % by Category 📈
💡 Understand which genres or content types resonate most with audiences.
✅ 🌍 Platform Analysis Page – Compare Digital Performance
See how your content performs across platforms like websites, apps, or partner portals.
Metrics include:
-
Word Count by Platform ✍️
-
Views by Platform 👀
-
In-Review % by Platform 🔎
🚀 Perfect for digital managers optimizing platform reach and audience engagement.
✅ 📅 Monthly Trends Page – Track Growth Over Time
Visualize time-based performance using:
-
Revenue (USD) by Month
-
Views by Month
-
Publications Trend by Month
📊 Identify seasonal patterns, forecast future performance, and track consistency month-over-month.
📦 What’s Inside the Publishing Dashboard
📁 Five Analytical Pages:
1️⃣ Overview Page – Executive summary of publishing KPIs.
2️⃣ Department Analysis Page – Assess departmental efficiency.
3️⃣ Category Analysis Page – Track content category success.
4️⃣ Platform Analysis Page – Compare platform performance.
5️⃣ Monthly Trends Page – Evaluate progress across time.
🎯 Core KPIs Tracked:
-
Total Publications
-
In-Review %
-
Revenue (USD)
-
Published %
-
Likes & Views
-
Word Count per Platform
💡 Each page features dynamic slicers and clean visualizations, making insights clear and actionable for every user.
⚙️ How to Use the Publishing Dashboard
1️⃣ Connect Data: Link Excel or your preferred data source using Power Query.
2️⃣ Refresh Regularly: Enable automatic refresh to ensure real-time metrics.
3️⃣ Filter & Analyze: Use slicers to filter by region, department, author, or platform.
4️⃣ Drill Down: Explore individual KPIs to uncover detailed insights.
5️⃣ Export & Share: Publish the dashboard to Power BI Service for collaboration.
💡 Pro Tip: Add time-based comparisons (MTD/YTD) to monitor progress toward yearly goals.
👥 Who Can Benefit from This Dashboard
📚 Publishers & Media Houses – Monitor publication volume, revenue, and author performance.
🧑💼 Editorial Teams – Track in-review vs. published ratios to enhance workflow efficiency.
💰 Finance Teams – Visualize revenue growth and profitability by category or platform.
📈 Marketing Departments – Measure engagement through views, likes, and reach metrics.
🧠 Executives & Decision-Makers – Access a high-level overview for strategic planning.
📱 Digital Content Managers – Compare platform performance and optimize reach.
No matter your publishing model — print, digital, or hybrid — this Power BI dashboard brings your entire performance story to life.
🔗 Click here to read the Detailed Blog Post
🎥 Visit our YouTube channel to learn step-by-step video tutorials


Reviews
There are no reviews yet.