


⚡ Gain real-time visibility into your IT support operations with this interactive Power BI dashboard—track SLA compliance, technician performance, resolution trends, and customer satisfaction with powerful visual insights.
The IT Services Dashboard in Power BI is a ready-to-use, fully interactive reporting tool built for IT departments and service management teams. It enables businesses to monitor key service metrics such as total requests, SLA breaches, response times, resolution times, and customer ratings—all within a centralized visual environment.
With five powerful pages, this dashboard offers deep visibility into SLA compliance, technician performance, departmental efficiency, and overall customer experience—giving IT teams the intelligence they need to improve service delivery and meet performance goals.

🔍 Key Features:
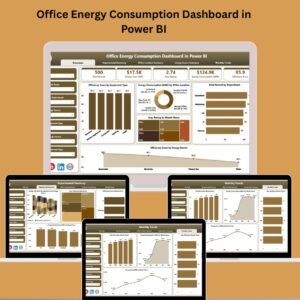
📌 1. Overview Page: High-Level Metrics at a Glance
-
Cards show Total Requests, Avg. Resolution Time (hrs), Avg. Response Time (hrs), SLA Breach %
-
Charts include:
-
Total Requests by Status, Region, and Month
-
Avg. Customer Rating by Technician
-
Total Requests by Request Month
-
📌 2. SLA Compliance Page
-
Track SLA Breach % by Department
-
Monitor SLA Met % by Priority and Month
-
Identify SLA issues and act before they escalate
📌 3. Technician Performance Page
-
Analyze Avg. Customer Ratings and Avg. Resolution Time by Technician
-
Spot top performers and performance gaps
-
Total Requests by Assigned Technician
📌 4. Resolution Time Analysis Page
-
Avg. Resolution Time by Region, Priority, and Department
-
Identify operational bottlenecks
-
Optimize ticket workflows and resource allocation
📌 5. Customer Experience Page
-
Avg. Customer Rating by Service Type, Priority, and Department
-
Identify customer satisfaction trends
-
Discover service types needing improvement
🎯 Who Is It For?
-
IT Managers & Service Leaders – Oversee SLA compliance and team performance
-
Helpdesk Supervisors – Track resolution times and technician workload
-
Managed Service Providers (MSPs) – Monitor KPIs across clients and departments
-
Service Desk Analysts – Dive into visual performance metrics
-
CIOs & Decision Makers – Get big-picture visibility into IT operations
📊 Why This Dashboard?
-
✅ No coding required – Just plug your Excel data into Power BI
-
⚡ Real-time insights – Always stay updated with the latest metrics
-
🧩 Fully customizable – Add or tweak KPIs, visuals, and filters as needed
-
👨💼 Team-friendly – Easily share the dashboard with internal/external stakeholders
Whether you’re struggling with SLA breaches or simply want to optimize service delivery, this dashboard offers everything you need in one visual hub.


Reviews
There are no reviews yet.