Modern agriculture is rapidly becoming data-driven and technology focused. Farmers, agronomists, agricultural consultants, and agribusiness companies now depend heavily on analytics to make better farming decisions. Crop advisory platforms collect large volumes of data related to crop costs, revenues, risks, and advisory recommendations. However, raw agricultural data alone cannot provide meaningful insights.
This is where the Crop Advisory Platforms Dashboard in Power BI becomes extremely valuable.
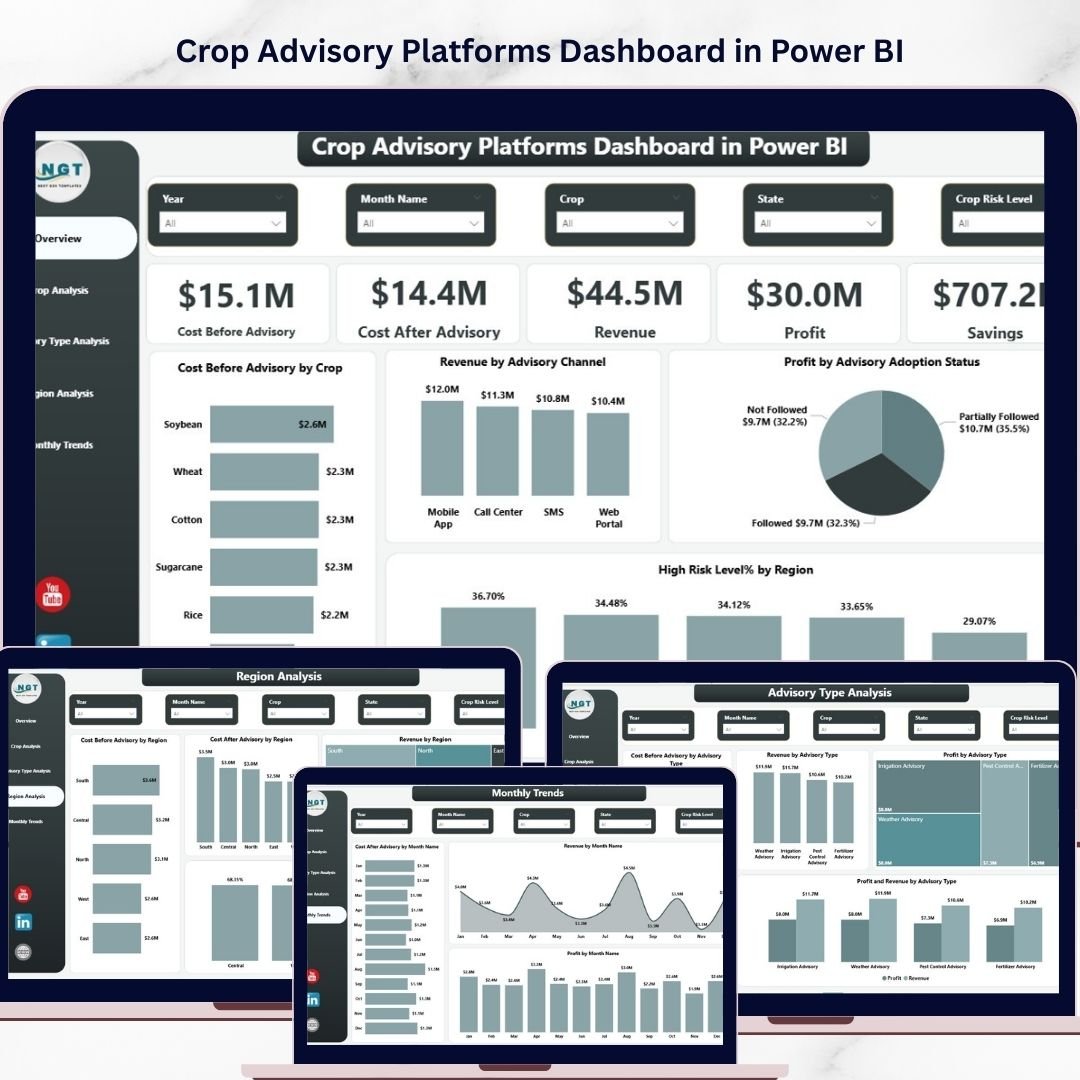
The Crop Advisory Platforms Dashboard in Power BI is a ready-to-use business intelligence solution that helps agricultural professionals analyze advisory effectiveness, crop profitability, and regional farming performance using interactive visuals. Instead of manually analyzing spreadsheets, users can instantly understand trends using powerful Power BI charts and KPI indicators.
With this dashboard, organizations can monitor cost before advisory, cost after advisory, revenue, profit, and cost savings. In addition, users can analyze crop performance, advisory channel effectiveness, regional agricultural performance, and seasonal trends.
As a result, agricultural organizations can reduce costs, increase crop profitability, and improve farming strategies using data-driven insights.
🌱 Key Features of Crop Advisory Platforms Dashboard in Power BI
This Power BI dashboard contains five powerful analytical pages that provide deep insights into crop advisory performance.
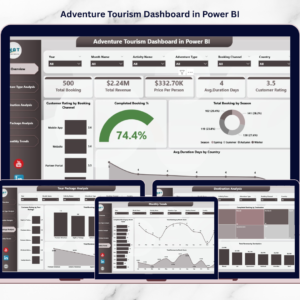
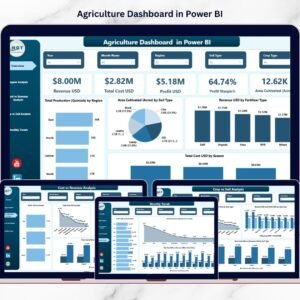
📊 Interactive Overview Dashboard
Provides a centralized view of key performance indicators including cost before advisory, cost after advisory, revenue, profit, and savings.
📊 Crop Performance Analysis
Analyze crop-wise performance including revenue, risk levels, profit margins, and advisory impact on farming costs.
📊 Advisory Type Analysis
Compare different advisory channels such as digital advisory platforms, field consultants, SMS advisory, and mobile applications.
📊 Regional Performance Insights
Understand agricultural profitability and advisory impact across different regions.
📊 Monthly Trend Analysis
Track seasonal agricultural performance and evaluate how advisory services influence farming outcomes across different months.
📊 Interactive Charts and Filters
Power BI slicers allow users to filter insights by crop, advisory type, region, and month.
📊 Financial Impact Tracking
Quickly monitor cost reduction, revenue growth, and profit improvements after implementing advisory recommendations.
📦 What’s Inside the Crop Advisory Platforms Dashboard in Power BI
This ready-to-use Power BI dashboard includes five analytical report pages designed for agricultural performance monitoring.
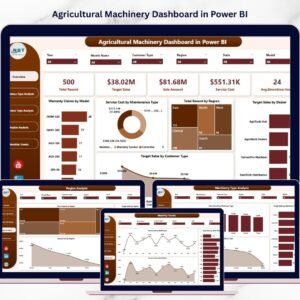
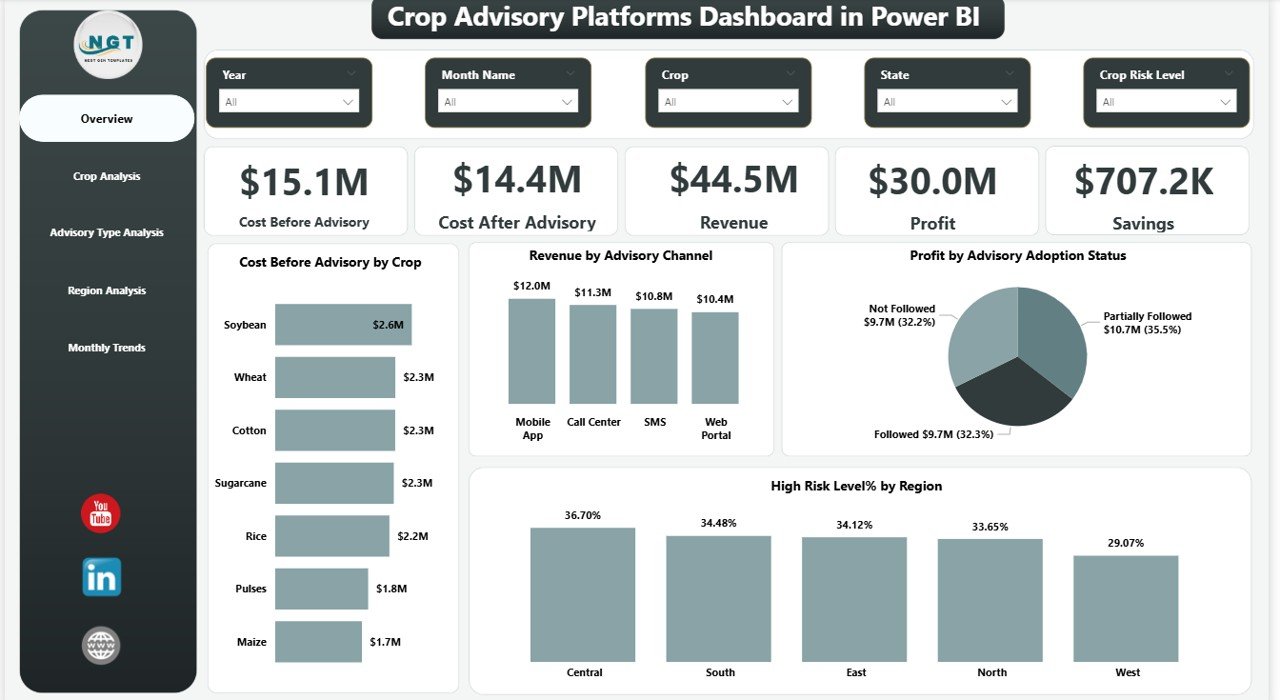
1️⃣ Overview Page
The overview page acts as the main control center of the dashboard.
It includes five KPI cards:
• Cost Before Advisory
• Cost After Advisory
• Revenue
• Profit
• Savings
Additionally, this page includes four analytical charts:
• Cost Before Advisory Analysis
• Revenue by Advisory Channel
• Profit by Advisory Adoption Status
• High Risk Level % by Region
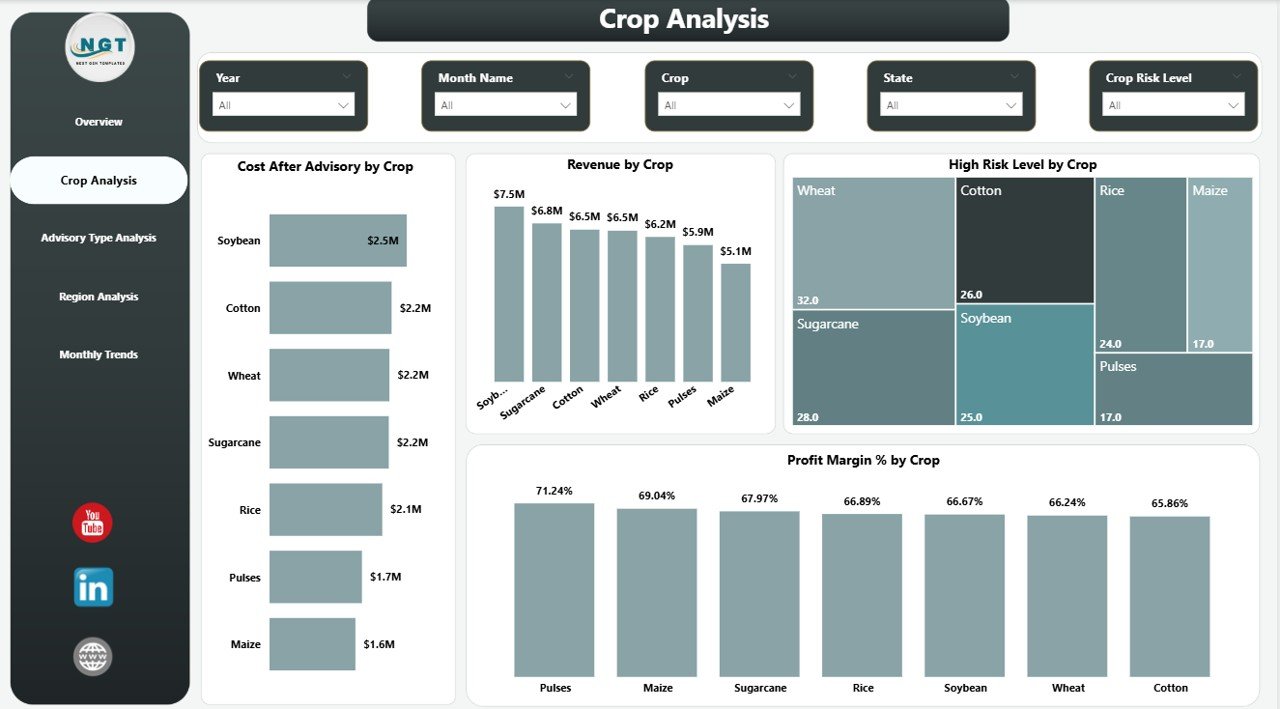
2️⃣ Crop Analysis
This page focuses on crop-level performance insights.
Charts included:
• Cost After Advisory by Crop
• Revenue by Crop
• High Risk Level by Crop
• Profit Margin % by Crop
This helps organizations identify the most profitable and least risky crops.
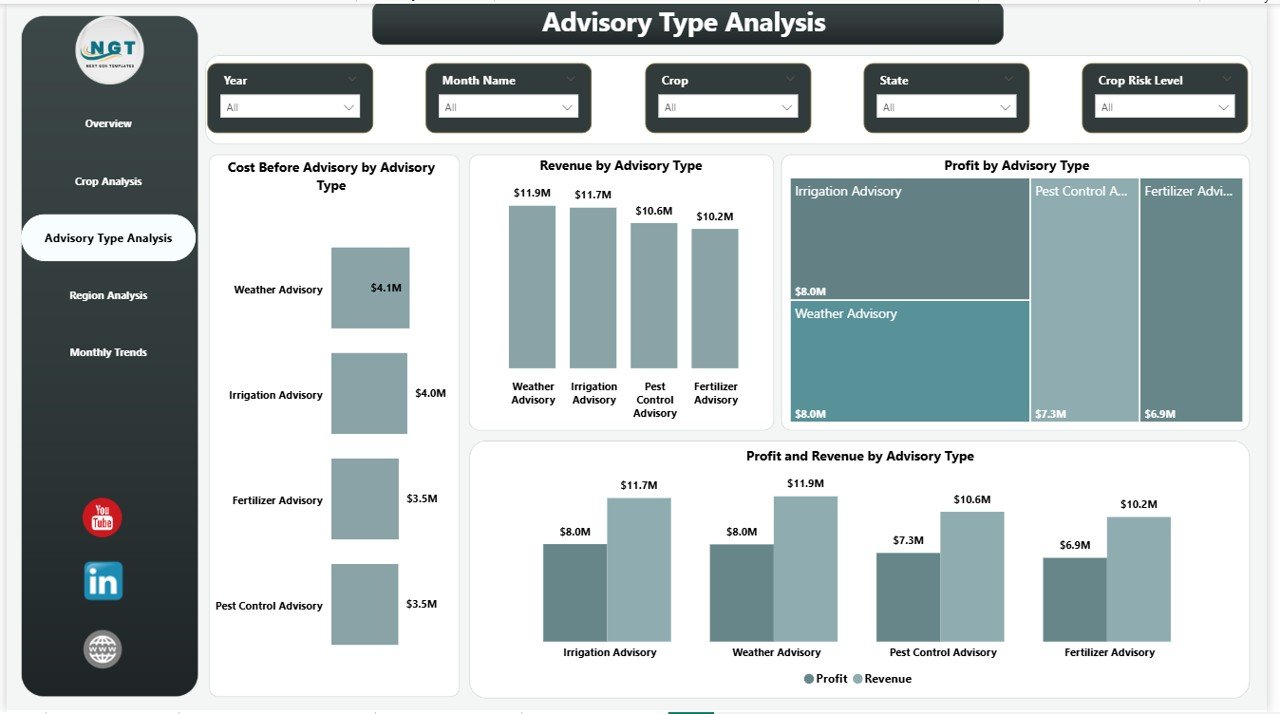
3️⃣ Advisory Type Analysis
This page evaluates different advisory platforms and their impact.
Charts included:
• Cost Before Advisory by Advisory Type
• Revenue by Advisory Type
• Profit by Advisory Type
• Profit vs Revenue by Advisory Type
This helps organizations identify which advisory channels deliver the best results.
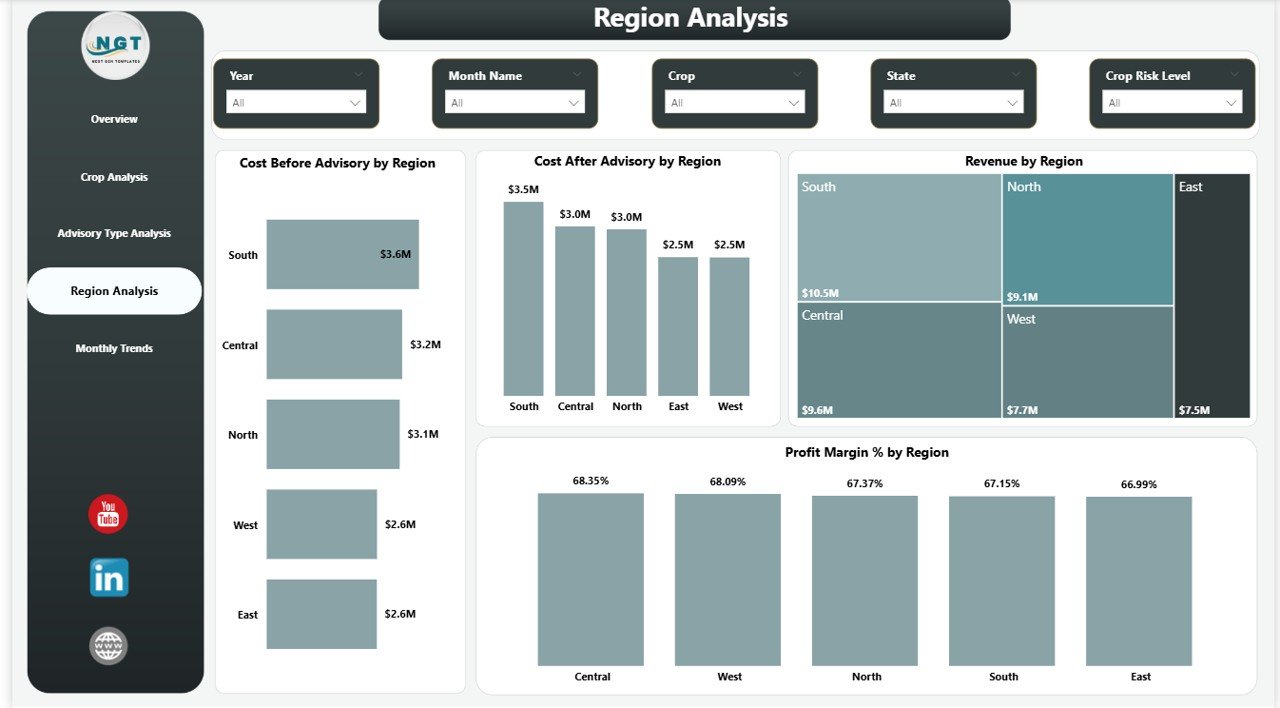
4️⃣ Region Analysis
This page analyzes agricultural performance across regions.
Charts included:
• Cost Before Advisory by Region
• Cost After Advisory by Region
• Revenue by Region
• Profit Margin % by Region
Organizations can easily identify high-performing and high-risk regions.
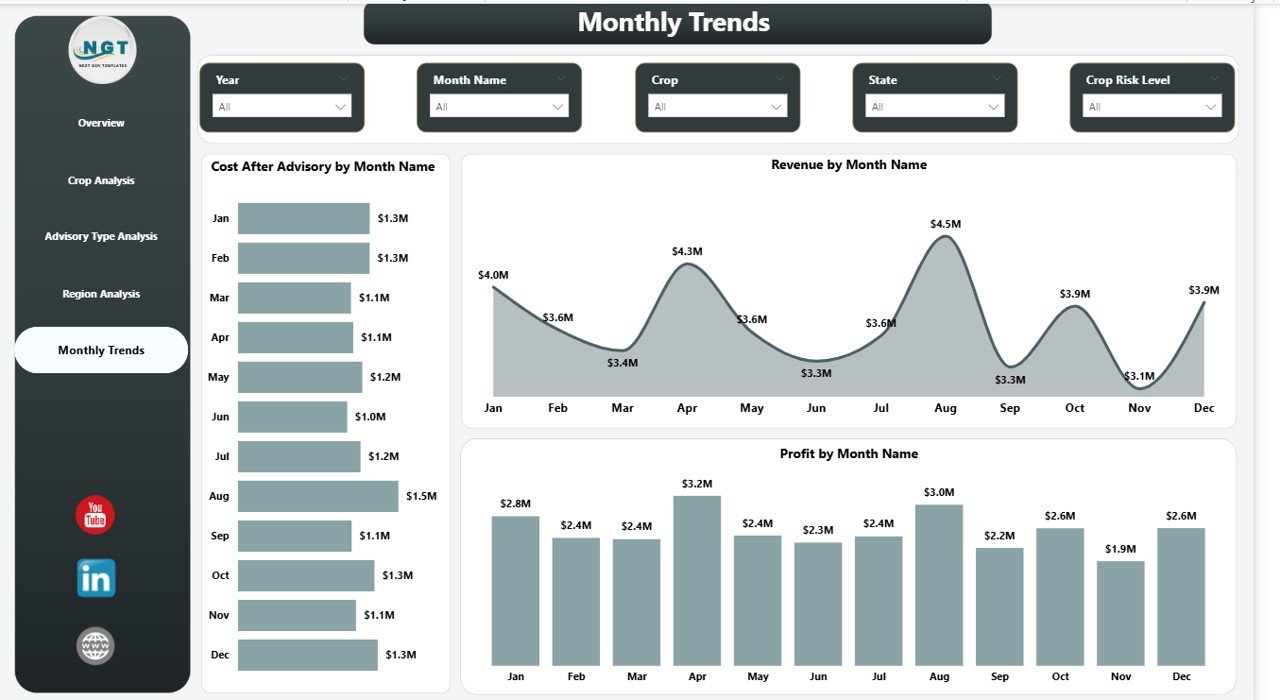
5️⃣ Month Analysis
Agriculture is highly seasonal. This page tracks monthly performance trends.
Charts included:
• Cost After Advisory by Month
• Revenue by Month
• Profit by Month
This helps users identify seasonal profitability patterns.
🚀 How to Use the Crop Advisory Platforms Dashboard in Power BI
Using this dashboard is extremely simple.
1️⃣ Import your agricultural dataset into Power BI.
2️⃣ Ensure your dataset includes fields such as crop type, region, advisory type, costs, revenue, and dates.
3️⃣ Connect the dataset to the dashboard.
4️⃣ Use the interactive slicers to filter insights.
5️⃣ Analyze KPIs and charts to identify profitability trends and advisory impact.
Within seconds, you can generate powerful agricultural insights without complex calculations.
👨🌾 Who Can Benefit from This Crop Advisory Platforms Dashboard in Power BI
This dashboard is useful for many stakeholders across the agricultural ecosystem.
🌾 Farmers
Monitor crop profitability and evaluate advisory recommendations.
🌾 Agronomists
Analyze crop health trends and farming performance.
🌾 Agribusiness Companies
Track crop performance across multiple regions and advisory platforms.
🌾 Government Agencies
Evaluate agricultural advisory programs and policy outcomes.
🌾 Agricultural Consultants
Provide data-driven recommendations to improve crop productivity.
🌾 Agricultural Technology Platforms
Analyze advisory effectiveness and optimize digital advisory solutions.
Click here to read the Detailed blog post
Watch the step-by-step video tutorial: