


In today’s rapidly evolving digital landscape, Artificial Intelligence (AI) and Machine Learning (ML) are transforming how businesses operate — automating decisions, predicting outcomes, and improving efficiency. However, managing AI initiatives requires accurate, ongoing performance tracking. That’s where the AI and Machine Learning KPI Scorecard in Excel comes in.
This ready-to-use Excel-based scorecard provides a centralized, dynamic, and data-driven system to monitor AI model performance, track KPIs, and visualize trends — all without the need for coding or complex BI software.
Designed for data scientists, analysts, and business leaders, this scorecard helps ensure that AI models remain accurate, efficient, and aligned with organizational goals.
⚙️ Key Features of the AI and Machine Learning KPI Scorecard
📊 Four Key Worksheets:
-
Scorecard (Main Dashboard) – Displays all KPIs with Actual vs Target comparisons.
-
KPI Trend Sheet – Visualizes monthly and yearly trends for any KPI.
-
Input Data Sheet – Stores all raw data including actuals, targets, and categories.
-
KPI Definition Sheet – Defines each KPI with its formula, unit, and performance direction.
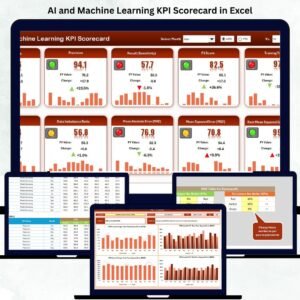
🎯 KPI Metrics: Track Model Accuracy, Training Time, Data Quality, ROI, Error Rate, and Deployment Success.
📅 Month Selector: Choose any month and view instant updates for MTD (Month-to-Date) or YTD (Year-to-Date).
📈 Trend Analysis: Compare Actual vs Target vs Previous Year through automated charts.
🟩 Visual Indicators: Conditional formatting with color codes (Green = Good, Yellow = Moderate, Red = Poor).
⚙️ Fully Customizable: Add or modify KPIs, formulas, and visualizations to match your AI project needs.
💻 No Extra Software: Works 100% in Microsoft Excel — no Power BI or VBA coding required.
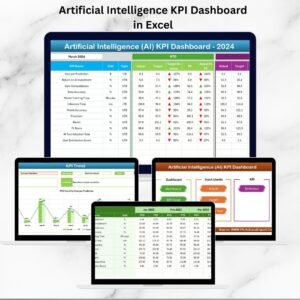
📋 Scorecard Structure Overview
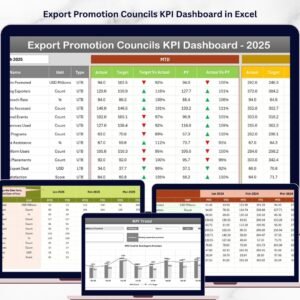
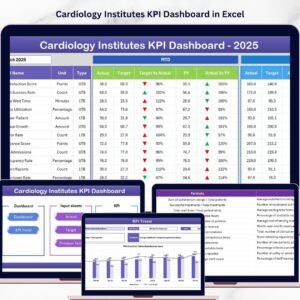
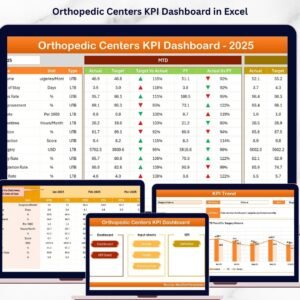
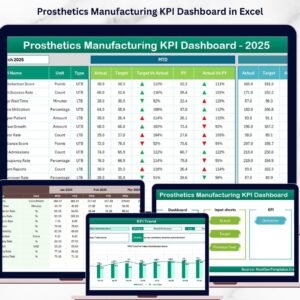
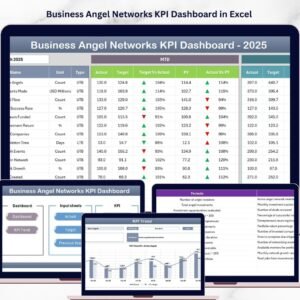
📊 1️⃣ Scorecard Sheet – The Command Center
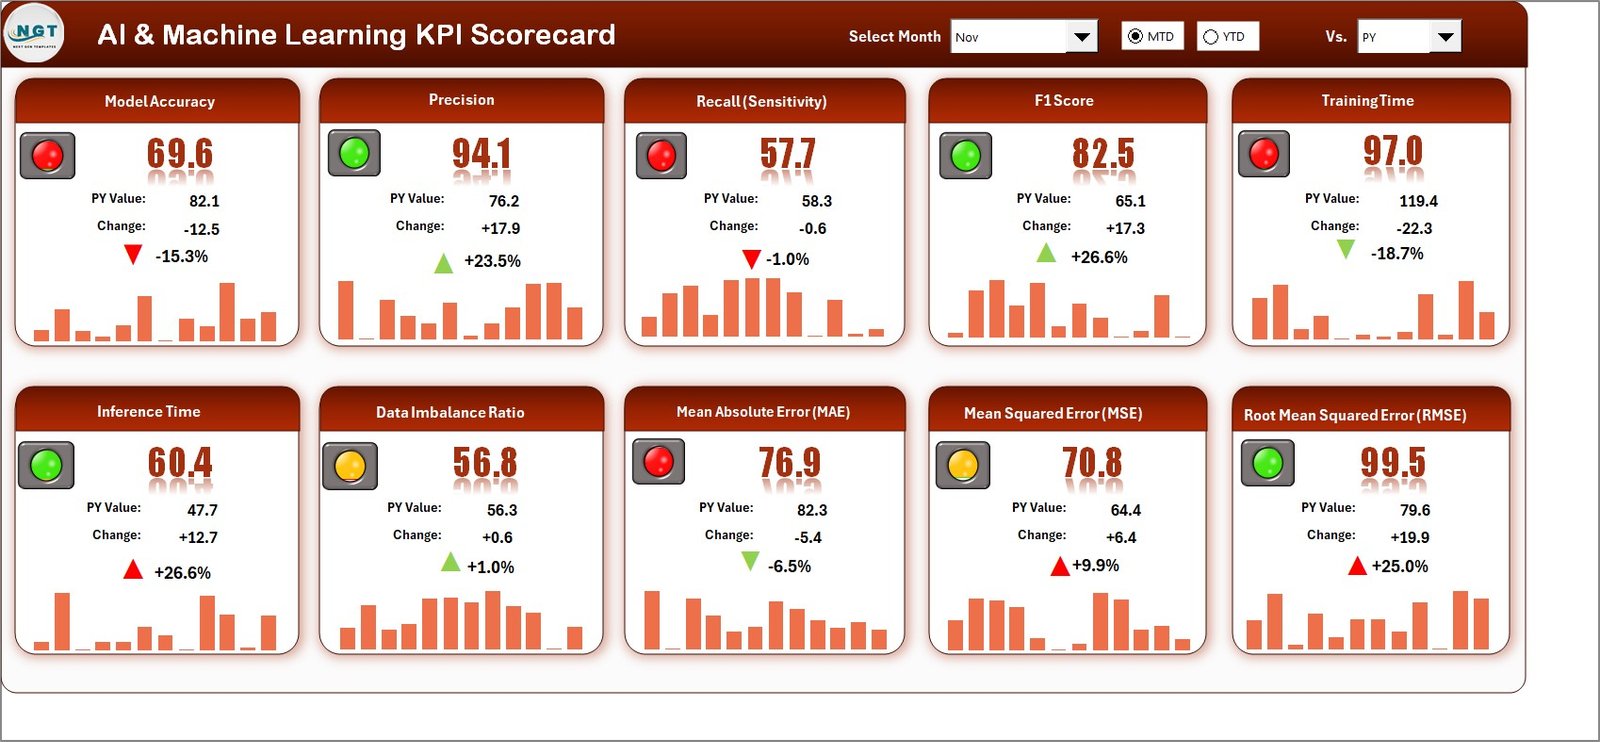
The Scorecard sheet provides an instant view of AI model health.
-
Choose MTD or YTD toggle options.
-
View Actual, Target, and Previous Year comparisons.
-
Analyze key metrics like Accuracy, Precision, and ROI side by side.
💡 Purpose: Get a one-glance performance summary for all AI KPIs.
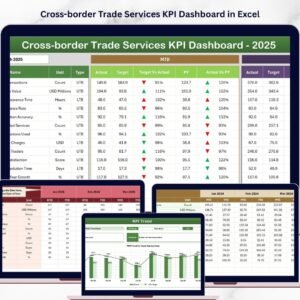
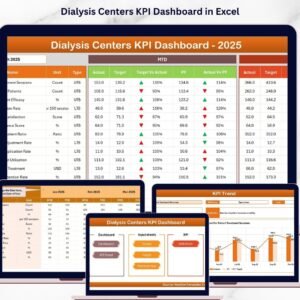
📈 2️⃣ KPI Trend Sheet – Insightful Analytics Over Time
Choose any KPI (cell C3) to explore month-over-month or year-over-year performance.
-
View KPI details: Formula, Unit, Type (Upper/Lower the Better).
-
Analyze interactive charts for Actual, Target, and Previous Year values.
📊 Purpose: Identify improvements, trends, or signs of model degradation (e.g., data drift).
🧾 3️⃣ Input Data Sheet – Central Data Repository
Store Actual, Target, and Previous Year data for each KPI.
-
Data auto-refreshes visuals on other sheets.
-
Compatible with CSV or API imports from AI tools.
📘 4️⃣ KPI Definition Sheet – KPI Reference Library
Define every KPI’s calculation logic and objective.
Includes: KPI Group, Unit, Formula, Definition, and Performance Direction.
Ensures clarity, consistency, and standardization across AI projects.
🤖 Key AI and ML KPIs Included
Model Performance KPIs
-
Model Accuracy (%), Precision (%), Recall (%), F1-Score, ROC-AUC Score
Operational Efficiency KPIs
-
Model Training Time (min), Inference Time (sec), Deployment Success Rate (%), Model Downtime (hrs)
Data Quality KPIs
-
Data Completeness (%), Consistency (%), Null Value Ratio (%), Duplicate Records (%)
Business Impact KPIs
-
Cost per Prediction ($), ROI from AI Implementation (%), Automation Success Rate (%), Error Reduction (%)
Each KPI is clearly defined, measurable, and fully editable.
🌟 Advantages of Using the AI & ML KPI Scorecard in Excel
✅ Centralized Monitoring: Track all AI performance metrics in one visual dashboard.
✅ Improved Decision-Making: Use data-driven visuals to prioritize actions and improvements.
✅ Time Efficiency: Once data is updated, all visuals auto-refresh instantly.
✅ Universal Accessibility: Excel-based — easy for technical and non-technical users.
✅ Transparency & Accountability: Shared understanding of metrics across departments.
✅ Customization: Add KPIs, integrate Power Query, or extend to Power BI.
✅ No Coding Required: Ready-to-use structure and formulas included.
💡 Best Practices for Optimal Use
📌 Update KPI data consistently (weekly or monthly).
📌 Keep definitions and formulas standardized.
📌 Use conditional formatting to highlight performance zones.
📌 Back up data and track changes using version control.
📌 Integrate with Power BI or Python for automation if needed.
🔍 Example Use Case
A fintech company tracks model accuracy, fraud detection rate, and ROI using the scorecard. When accuracy drops below 90%, the KPI Trend sheet reveals a negative data drift trend. The team retrains the model, improving performance to 95%.
Result: The dashboard turns insights into immediate corrective action.
🧩 Conclusion
The AI and Machine Learning KPI Scorecard in Excel is not just a reporting tool — it’s a performance intelligence system. It transforms raw AI metrics into actionable insights, aligning technical performance with business goals.
Whether you’re monitoring model accuracy, cost efficiency, or automation ROI, this Excel-based template helps you visualize success and identify improvement areas — all within a simple, intuitive interface.


Reviews
There are no reviews yet.